Exhibit (c)(9)
|
Confidential Presentation to the Special Committee June 29, 2020 |
 |
Confidential These materials have been prepared by Evercore Group L.L.C. (“Evercore”) for the Special Committee of the Board of Directors (the “Committee”) of GCI Liberty, Inc. (“GLIB” or the “Company”) to whom such materials are directly addressed and delivered and may not be used or relied upon for any purpose other than as specifically contemplated by a written agreement with Evercore. These materials are based on information provided by or on behalf of the Committee, including from Company management, and/or other potential transaction participants, or from public sources or otherwise reviewed by Evercore. Evercore assumes no responsibility for independent investigation or verification of such information and has relied on such information being complete and accurate in all material respects. To the extent such information includes estimates and forecasts of future financial performance prepared by or reviewed with the management of the Company and/or other potential transaction participants or obtained from public sources, Evercore has assumed that such estimates and forecasts have been reasonably prepared on bases reflecting the best currently available estimates and judgments of such management (or, with respect to estimates and forecasts obtained from public sources, represent reasonable estimates). No representation or warranty, express or implied, is made as to the accuracy or completeness of such information and nothing contained herein is, or shall be relied upon as, a representation, whether as to the past, the present or the future. These materials were designed for use by specific persons familiar with the business and affairs of the Company. These materials are not intended to provide the sole basis for evaluating, and should not be considered a recommendation with respect to, any transaction or other matter. These materials have been developed by and are proprietary to Evercore and were prepared exclusively for the benefit and internal use of the Committee. These materials were compiled on a confidential basis for use by the Committee in evaluating the potential transaction described herein and not with a view to public disclosure or filing thereof under state or federal securities laws, and may not be reproduced, disseminated, quoted or referred to, in whole or in part, without the prior written consent of Evercore. These materials do not constitute an offer or solicitation to sell or purchase any securities and are not a commitment by Evercore (or any affiliate) to provide or arrange any financing for any transaction or to purchase any security in connection therewith. Evercore assumes no obligation to update or otherwise revise these materials. These materials may not reflect information known to other professionals in other business areas of Evercore and its affiliates. Evercore and its affiliates do not provide legal, accounting or tax advice. Accordingly, any statements contained herein as to tax matters were neither written nor intended by Evercore or its affiliates to be used and cannot be used by any taxpayer for the purpose of avoiding tax penalties that may be imposed on such taxpayer. Each person should seek legal, accounting and tax advice based on his, her or its particular circumstances from independent advisors regarding the impact of the transactions or matters described herein. |
 |
Confidential Table of Contents Section Transaction Proposal Preliminary Analysis I GLIB Preliminary Financial Analysis II LBRD Preliminary Financial Analysis III Appendix |
 |
Confidential I. Transaction Proposal Preliminary Analysis |
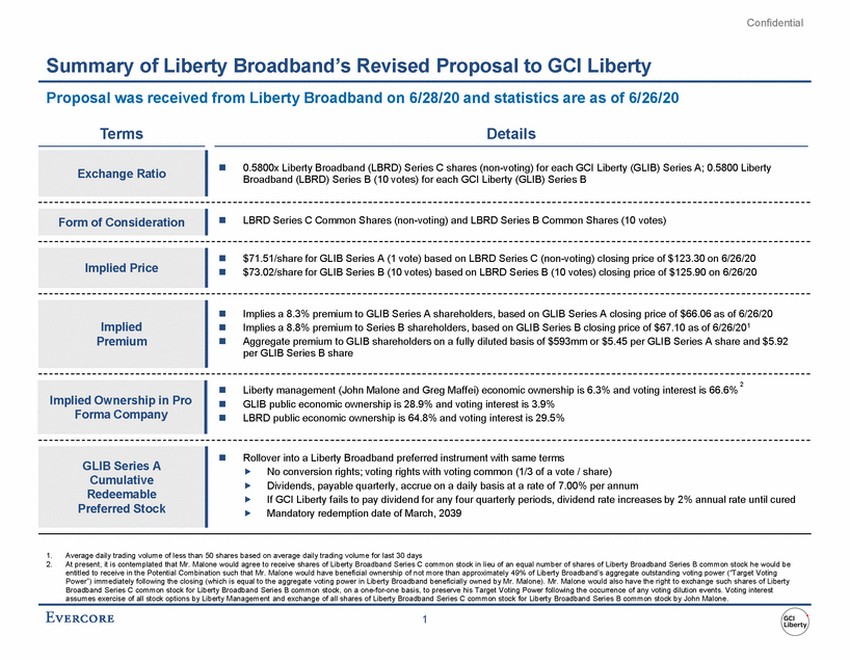 |
Confidential Summary of Liberty Broadband’s Revised Proposal to GCI Liberty Proposal was received from Liberty Broadband on 6/28/20 and statistics are as of 6/26/20 Terms Details 0.5800x Liberty Broadband (LBRD) Series C shares (non-voting) for each GCI Liberty (GLIB) Series A; 0.5800 Liberty Broadband (LBRD) Series B (10 votes) for each GCI Liberty (GLIB) Series B LBRD Series C Common Shares (non-voting) and LBRD Series B Common Shares (10 votes) $71.51/share for GLIB Series A (1 vote) based on LBRD Series C (non-voting) closing price of $123.30 on 6/26/20 $73.02/share for GLIB Series B (10 votes) based on LBRD Series B (10 votes) closing price of $125.90 on 6/26/20 Implies a 8.3% premium to GLIB Series A shareholders, based on GLIB Series A closing price of $66.06 as of 6/26/20 Implies a 8.8% premium to Series B shareholders, based on GLIB Series B closing price of $67.10 as of 6/26/201 Aggregate premium to GLIB shareholders on a fully diluted basis of $593mm or $5.45 per GLIB Series A share and $5.92 per GLIB Series B share 2 Liberty management (John Malone and Greg Maffei) economic ownership is 6.3% and voting interest is 66.6% GLIB public economic ownership is 28.9% and voting interest is 3.9% LBRD public economic ownership is 64.8% and voting interest is 29.5% Rollover into a Liberty Broadband preferred instrument with same terms No conversion rights; voting rights with voting common (1/3 of a vote / share) Dividends, payable quarterly, accrue on a daily basis at a rate of 7.00% per annum If GCI Liberty fails to pay dividend for any four quarterly periods, dividend rate increases by 2% annual rate until cured Mandatory redemption date of March, 2039 1. 2. Average daily trading volume of less than 50 shares based on average daily trading volume for last 30 days At present, it is contemplated that Mr. Malone would agree to receive shares of Liberty Broadband Series C common stock in lieu of an equal number of shares of Liberty Broadband Series B common stock he would be entitled to receive in the Potential Combination such that Mr. Malone would have beneficial ownership of not more than approximately 49% of Liberty Broadband’s aggregate outstanding voting power (“Target Voting Power”) immediately following the closing (which is equal to the aggregate voting power in Liberty Broadband beneficially owned by Mr. Malone). Mr. Malone would also have the right to exchange such shares of Liberty Broadband Series C common stock for Liberty Broadband Series B common stock, on a one-for-one basis, to preserve his Target Voting Power following the occurrence of any voting dilution events. Voting interest assumes exercise of all stock options by Liberty Management and exchange of all shares of Liberty Broadband Series C common stock for Liberty Broadband Series B common stock by John Malone. 1 GLIB Series A Cumulative Redeemable Preferred Stock Implied Ownership in Pro Forma Company Implied Premium Implied Price Form of Consideration Exchange Ratio |
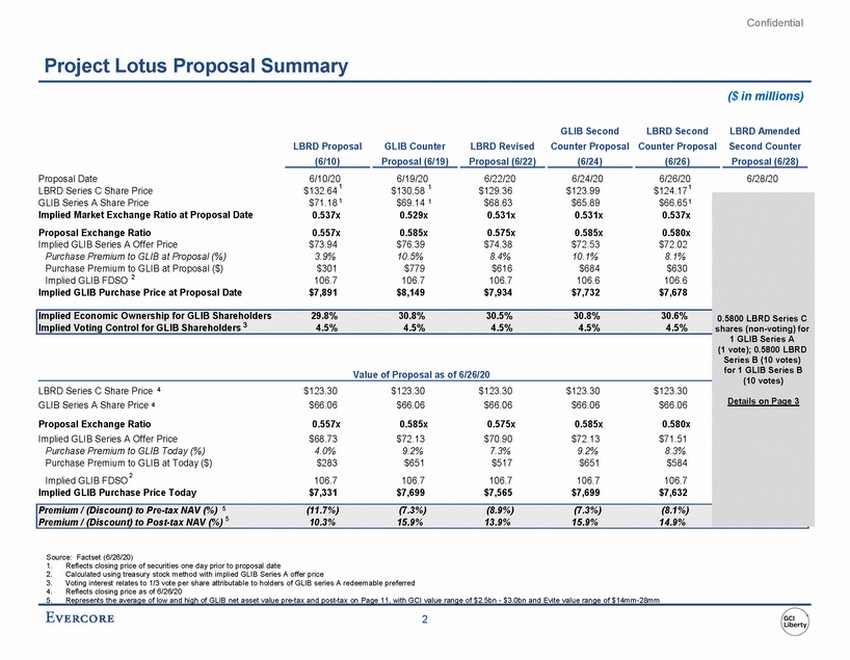 |
Confidential Project Lotus Proposal Summary ($ in millions) GLIB Second LBRD Second LBRD Amended LBRD Proposal GLIB Counter LBRD Revised Counter Proposal Counter Proposal Second Counter (6/10) Proposal (6/19) Proposal (6/22) (6/24) (6/26) Proposal (6/28) Proposal Date LBRD Series C Share Price 6/10/20 $132.64 1 6/19/20 $130.58 1 6/22/20 $129.36 6/24/20 $123.99 6/26/20 $124.171 6/28/20 Implied Voting Control for GLIB Shareholders 3 4.5% 4.5% 4.5% 4.5% 4.5% Implied GLIB FDSO 106.7 106.7 106.7 106.7 106.7 Source: Factset (6/26/20) 1. 2. 3. 4. Reflects closing price of securities one day prior to proposal date Calculated using treasury stock method with implied GLIB Series A offer price Voting interest relates to 1/3 vote per share attributable to holders of GLIB series A redeemable preferred Reflects closing price as of 6/26/20 5. Represents the average of low and high of GLIB net asset value pre-tax and post-tax on Page 11, with GCI value range of $2.5bn - $3.0bn and Evite value range of $14mm-28mm 2 GLIB Series A Share Price $71.18 1$69.14 1$68.63 $65.89 $66.651 Implied Market Exchange Ratio at Proposal Date 0.537x 0.529x 0.531x 0.531x 0.537x Proposal Exchange Ratio 0.557x 0.585x 0.575x 0.585x 0.580x Implied GLIB Series A Offer Price $73.94 $76.39 $74.38 $72.53 $72.02 Purchase Premium to GLIB at Proposal (%) 3.9% 10.5% 8.4% 10.1% 8.1% Purchase Premium to GLIB at Proposal ($) $301 $779 $616 $684 $630 Implied GLIB FDSO 2106.7 106.7 106.7 106.6 106.6 Implied GLIB Purchase Price at Proposal Date $7,891 $8,149 $7,934 $7,732 $7,678 0.5800 LBRD Series C shares (non-voting) for 1 GLIB Series A (1 vote); 0.5800 LBRD Series B (10 votes) for 1 GLIB Series B (10 votes) Details on Page 3 Implied Economic Ownership for GLIB Shareholders 29.8% 30.8% 30.5% 30.8% 30.6% Value of Proposal as of 6/26/20 LBRD Series C Share Price 4$123.30 $123.30 $123.30 $123.30 $123.30 GLIB Series A Share Price 4$66.06 $66.06 $66.06 $66.06 $66.06 Proposal Exchange Ratio 0.557x 0.585x 0.575x 0.585x 0.580x Implied GLIB Series A Offer Price $68.73 $72.13 $70.90 $72.13 $71.51 Purchase Premium to GLIB Today (%) 4.0% 9.2% 7.3% 9.2% 8.3% Purchase Premium to GLIB at Today ($) $283 $651 $517 $651 $584 2 Implied GLIB Purchase Price Today $7,331 $7,699 $7,565 $7,699 $7,632 Premium / (Discount) to Pre-tax NAV (%) 5(11.7%) (7.3%) (8.9%) (7.3%) (8.1%) Premium / (Discount) to Post-tax NAV (%) 5 10.3% 15.9% 13.9% 15.9% 14.9% |
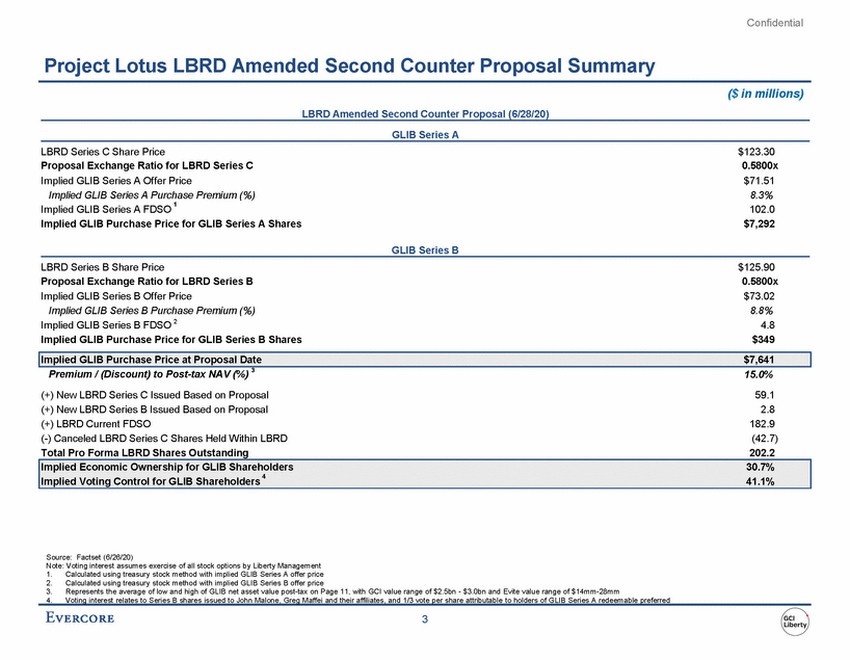 |
Confidential Project Lotus LBRD Amended Second Counter Proposal Summary ($ in millions) LBRD Amended Second Counter Proposal (6/28/20) GLIB Series A LBRD Series C Share Price Proposal Exchange Ratio for LBRD Series C Implied GLIB Series A Offer Price Implied GLIB Series A Purchase Premium (%) $123.30 0.5800x $71.51 8.3% 102.0 $7,292 1 Implied GLIB Series A FDSO Implied GLIB Purchase Price for GLIB Series A Shares GLIB Series B LBRD Series B Share Price Proposal Exchange Ratio for LBRD Series B Implied GLIB Series B Offer Price Implied GLIB Series B Purchase Premium (%) Implied GLIB Series B FDSO 2 Implied GLIB Purchase Price for GLIB Series B Shares $125.90 0.5800x $73.02 8.8% 4.8 $349 Premium / (Discount) to Post-tax NAV (%) 3 15.0% 59.1 2.8 182.9 (42.7) 202.2 (+) New LBRD Series C Issued Based on Proposal (+) New LBRD Series B Issued Based on Proposal (+) LBRD Current FDSO (-) Canceled LBRD Series C Shares Held Within LBRD Total Pro Forma LBRD Shares Outstanding Implied Voting Control for GLIB Shareholders 41.1% Source: Factset (6/26/20) Note: Voting interest assumes exercise of all stock options by Liberty Management 1. 2. 3. Calculated using treasury stock method with implied GLIB Series A offer price Calculated using treasury stock method with implied GLIB Series B offer price Represents the average of low and high of GLIB net asset value post-tax on Page 11, with GCI value range of $2.5bn - $3.0bn and Evite value range of $14mm-28mm 4. Voting interest relates to Series B shares issued to John Malone, Greg Maffei and their affiliates, and 1/3 vote per share attributable to holders of GLIB Series A redeemable preferred 3 Implied Economic Ownership for GLIB Shareholders30.7% 4 Implied GLIB Purchase Price at Proposal Date$7,641 |
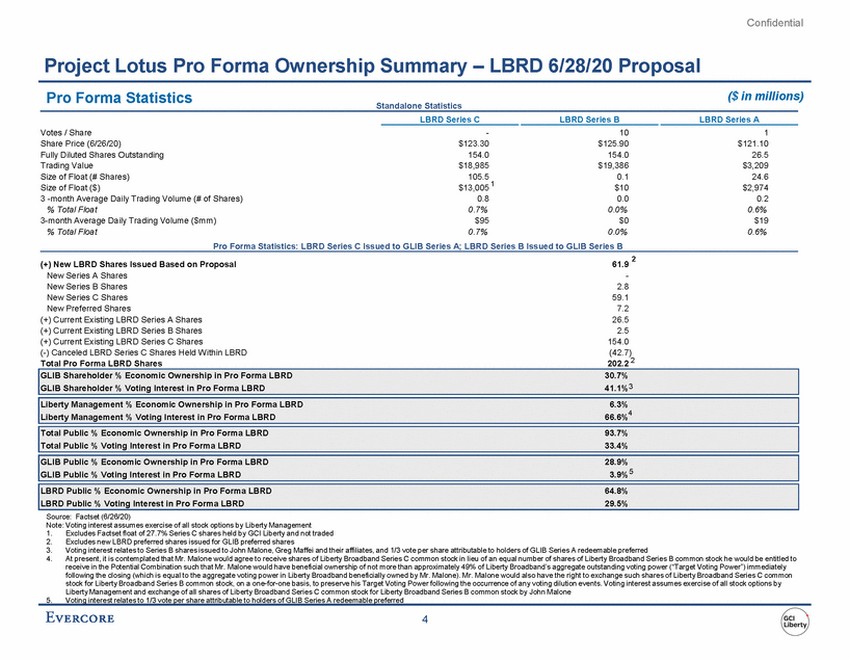 |
Confidential Project Lotus Pro Forma Ownership Summary – LBRD 6/28/20 Proposal Pro Forma Statistics ($ in millions) Standalone Statistics LBRD Series C LBRD Series B LBRD Series A Votes / Share Share Price (6/26/20) Fully Diluted Shares Outstanding Trading Value Size of Float (# Shares) Size of Float ($) 3 -month Average Daily Trading Volume (# of Shares) % Total Float 3-month Average Daily Trading Volume ($mm) % Total Float - $123.30 154.0 $18,985 10 $125.90 154.0 $19,386 0.1 $10 0.0 0.0% $0 0.0% 1 $121.10 26.5 $3,209 24.6 $2,974 0.2 0.6% $19 0.6% 105.5 $13,005 1 0.8 0.7% $95 0.7% Pro Forma Statistics: LBRD Series C Issued to GLIB Series A; LBRD Series B Issued to GLIB Series B 2 (+) New LBRD Shares Issued Based on Proposal New Series A Shares New Series B Shares New Series C Shares New Preferred Shares (+) Current Existing LBRD Series A Shares (+) Current Existing LBRD Series B Shares (+) Current Existing LBRD Series C Shares (-) Canceled LBRD Series C Shares Held Within LBRD Total Pro Forma LBRD Shares 61.9 - 2.8 59.1 7.2 26.5 2.5 154.0 (42.7) 202.2 2 Liberty Management % Voting Interest in Pro Forma LBRD 66.6% Source: Factset (6/26/20) Note: Voting interest assumes exercise of all stock options by Liberty Management 1. 2. 3. 4. Excludes Factset float of 27.7% Series C shares held by GCI Liberty and not traded Excludes new LBRD preferred shares issued for GLIB preferred shares Voting interest relates to Series B shares issued to John Malone, Greg Maffei and their affiliates, and 1/3 vote per share attributable to holders of GLIB Series A redeemable preferred At present, it is contemplated that Mr. Malone would agree to receive shares of Liberty Broadband Series C common stock in lieu of an equal number of shares of Liberty Broadband Series B common stock he would be entitled to receive in the Potential Combination such that Mr. Malone would have beneficial ownership of not more than approximately 49% of Liberty Broadband’s aggregate outstanding voting power (“Target Voting Power”) immediately following the closing (which is equal to the aggregate voting power in Liberty Broadband beneficially owned by Mr. Malone). Mr. Malone would also have the right to exchange such shares of Liberty Broadband Series C common stock for Liberty Broadband Series B common stock, on a one-for-one basis, to preserve his Target Voting Power following the occurrence of any voting dilution events. Voting interest assumes exercise of all stock options by Liberty Management and exchange of all shares of Liberty Broadband Series C common stock for Liberty Broadband Series B common stock by John Malone 5. Voting interest relates to 1/3 vote per share attributable to holders of GLIB Series A redeemable preferred 4 GLIB Shareholder % Economic Ownership in Pro Forma LBRD30.7% GLIB Shareholder % Voting Interest in Pro Forma LBRD41.1%3 Liberty Management % Economic Ownership in Pro Forma LBRD6.3% 4 Total Public % Economic Ownership in Pro Forma LBRD93.7% Total Public % Voting Interest in Pro Forma LBRD33.4% GLIB Public % Economic Ownership in Pro Forma LBRD28.9% GLIB Public % Voting Interest in Pro Forma LBRD3.9%5 LBRD Public % Economic Ownership in Pro Forma LBRD64.8% LBRD Public % Voting Interest in Pro Forma LBRD29.5% |
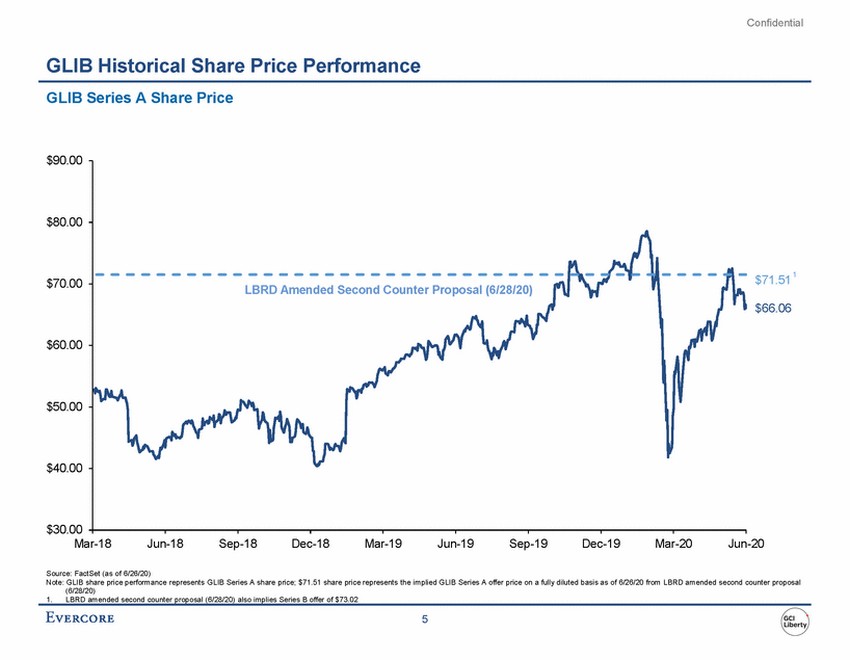 |
Confidential GLIB Historical Share Price Performance GLIB Series A Share Price $90.00 $80.00 1 $71.51 $70.00 $66.06 $60.00 $50.00 $40.00 $30.00 Mar-18 Jun-18 Sep-18 Dec-18 Mar-19 Jun-19 Sep-19 Dec-19 Mar-20 Jun-20 Source: FactSet (as of 6/26/20) Note: GLIB share price performance represents GLIB Series A share price; $71.51 share price represents the implied GLIB Series A offer price on a fully diluted basis as of 6/26/20 from LBRD amended second counter proposal (6/28/20) 1. LBRD amended second counter proposal (6/28/20) also implies Series B offer of $73.02 5 LBRD Amended Second Counter Proposal (6/28/20) |
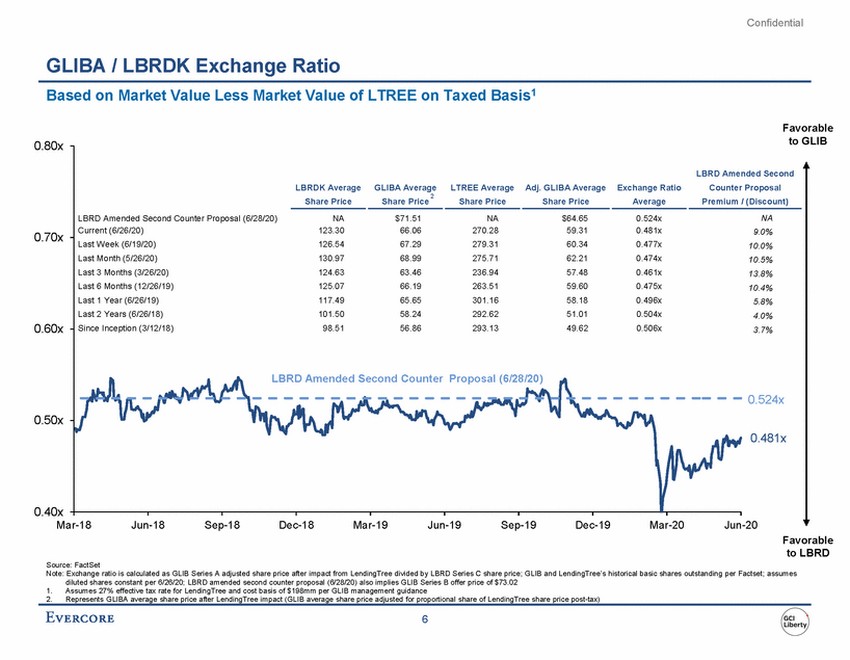 |
Confidential GLIBA / LBRDK Exchange Ratio Based on Market Value Less Market Value of LTREE on Taxed Basis1 Favorable to GLIB 0.80x ended Second Proposal / (Discount) NA 9.0% 10.0% 10.5% 13.8% 10.4% 5.8% 4.0% 3.7% 0.70x 0.60x 0.524x 0.50x 0.481x 0.40x Mar-18 Jun-18 Sep-18 Dec-18 Mar-19 Jun-19 Sep-19 Dec-19 Mar-20 Jun-20 Favorable to LBRD Source: FactSet Note: Exchange ratio is calculated as GLIB Series A adjusted share price after impact from LendingTree divided by LBRD Series C share price; GLIB and LendingTree’s historical basic shares outstanding per Factset; assumes diluted shares constant per 6/26/20; LBRD amended second counter proposal (6/28/20) also implies GLIB Series B offer price of $73.02 1. 2. Assumes 27% effective tax rate for LendingTree and cost basis of $198mm per GLIB management guidance Represents GLIBA average share price after LendingTree impact (GLIB average share price adjusted for proportional share of LendingTree share price post-tax) 6 LBRD Am LBRDK AverageGLIBA AverageLTREE AverageAdj. GLIBA AverageExchange RatioCounter 2 Share PriceShare PriceShare PriceShare PriceAveragePremium LBRD Amended Second Counter Proposal (6/28/20) NA $71.51 NA $64.65 0.524x Current (6/26/20) 123.30 66.06 270.28 59.31 0.481x Last Week (6/19/20) 126.54 67.29 279.31 60.34 0.477x Last Month (5/26/20) 130.97 68.99 275.71 62.21 0.474x Last 3 Months (3/26/20) 124.63 63.46 236.94 57.48 0.461x Last 6 Months (12/26/19) 125.07 66.19 263.51 59.60 0.475x Last 1 Year (6/26/19) 117.49 65.65 301.16 58.18 0.496x Last 2 Years (6/26/18) 101.50 58.24 292.62 51.01 0.504x Since Inception (3/12/18) 98.51 56.86 293.13 49.62 0.506x LBRD Amended Second Counter Proposal (6/28/20) |
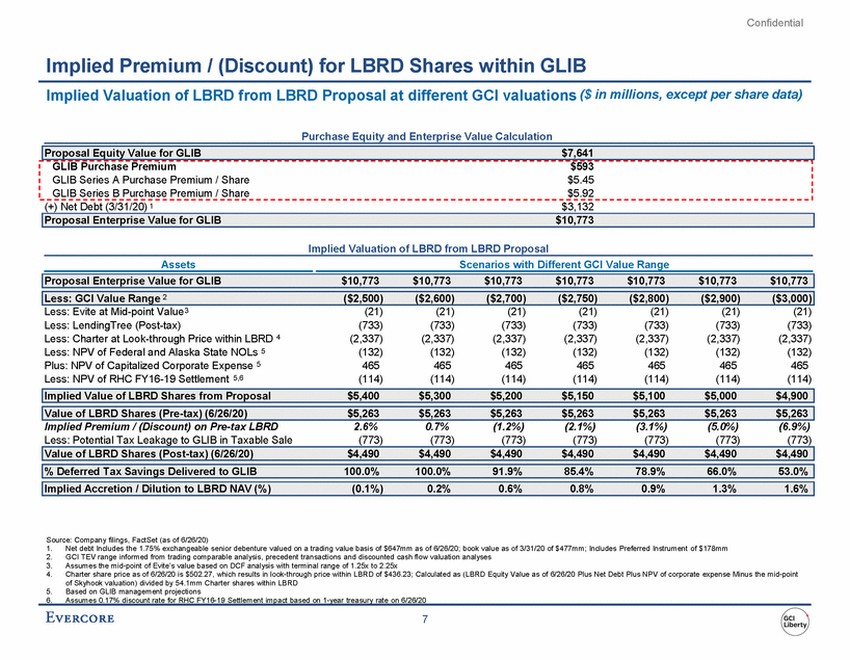 |
Confidential Implied Premium / (Discount) for LBRD Shares within GLIB Implied Valuation of LBRD from LBRD Proposal at different GCI valuations ($ in millions, except per share data) Purchase Equity and Enterprise Value Calculation (+) Net Debt (3/31/20) 1 $3,132 Implied Valuation of LBRD from LBRD Proposal Assets Scenarios with Different GCI Value Range Less: Evite at Mid-point Value 3 Less: LendingTree (Post-tax) Less: Charter at Look-through Price within LBRD 4 Less: NPV of Federal and Alaska State NOLs 5 Plus: NPV of Capitalized Corporate Expense 5 Less: NPV of RHC FY16-19 Settlement 5,6 (21) (733) (2,337) (132) 465 (114) (21) (733) (2,337) (132) 465 (114) (21) (733) (2,337) (132) 465 (114) (21) (733) (2,337) (132) 465 (114) (21) (733) (2,337) (132) 465 (114) (21) (733) (2,337) (132) 465 (114) (21) (733) (2,337) (132) 465 (114) Implied Premium / (Discount) on Pre-tax LBRD Less: Potential Tax Leakage to GLIB in Taxable Sale 2.6% (773) 0.7% (773) (1.2%) (773) (2.1%) (773) (3.1%) (773) (5.0%) (773) (6.9%) (773) Source: Company filings, FactSet (as of 6/26/20) 1. 2. 3. 4. Net debt Includes the 1.75% exchangeable senior debenture valued on a trading value basis of $647mm as of 6/26/20; book value as of 3/31/20 of $477mm; Includes Preferred Instrument of $178mm GCI TEV range informed from trading comparable analysis, precedent transactions and discounted cash flow valuation analyses Assumes the mid-point of Evite’s value based on DCF analysis with terminal range of 1.25x to 2.25x Charter share price as of 6/26/20 is $502.27, which results in look-through price within LBRD of $436.23; Calculated as (LBRD Equity Value as of 6/26/20 Plus Net Debt Plus NPV of corporate expense Minus the mid-point of Skyhook valuation) divided by 54.1mm Charter shares within LBRD Based on GLIB management projections 5. 6. Assumes 0.17% discount rate for RHC FY16-19 Settlement impact based on 1-year treasury rate on 6/26/20 7 Value of LBRD Shares (Post-tax) (6/26/20) $4,490 $4,490 $4,490 $4,490 $4,490 $4,490 $4,490 % Deferred Tax Savings Delivered to GLIB 100.0% 100.0% 91.9% 85.4% 78.9% 66.0% 53.0% Implied Accretion / Dilution to LBRD NAV (%) (0.1%) 0.2% 0.6% 0.8% 0.9% 1.3% 1.6% Implied Value of LBRD Shares from Proposal $5,400 $5,300 $5,200 $5,150 $5,100 $5,000 $4,900 Value of LBRD Shares (Pre-tax) (6/26/20) $5,263 $5,263 $5,263 $5,263 $5,263 $5,263 $5,263 Proposal Enterprise Value for GLIB $10,773 $10,773 $10,773 $10,773 $10,773 $10,773 $10,773 Less: GCI Value Range 2($2,500) ($2,600) ($2,700) ($2,750) ($2,800) ($2,900) ($3,000) Proposal Enterprise Value for GLIB $10,773 Proposal Equity Value for GLIB $7,641 GLIB Purchase Premium $593 GLIB Series A Purchase Premium / Share $5.45 GLIB Series B Purchase Premium / Share $5.92 |
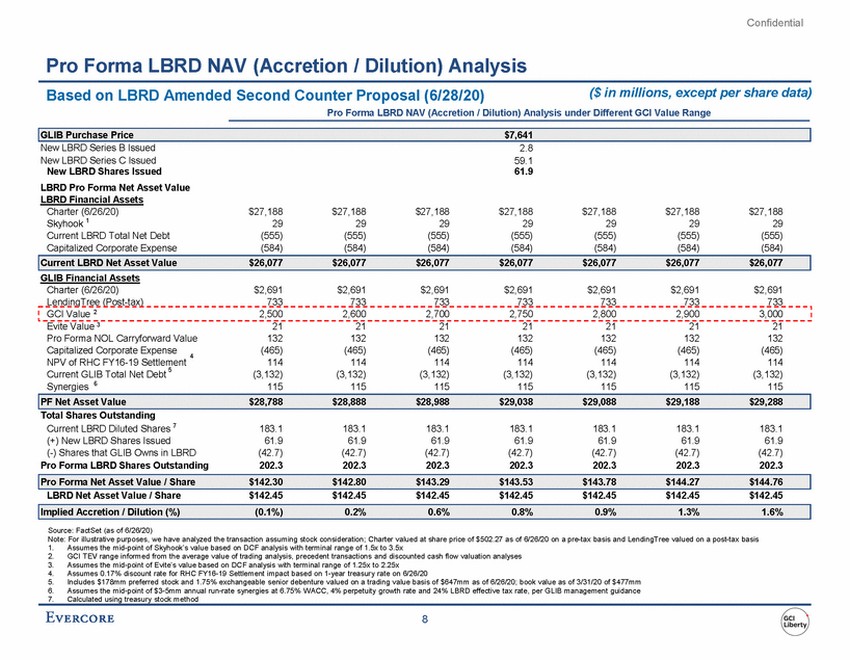 |
Confidential Pro Forma LBRD NAV (Accretion / Dilution) Analysis ($ in millions, except per share data) Based on LBRD Amended Second Counter Proposal (6/28/20) Pro Forma LBRD NAV (Accretion / Dilution) Analysis under Different GCI Value Range New LBRD Series B Issued New LBRD Series C Issued New LBRD Shares Issued LBRD Pro Forma Net Asset Value LBRD Financial Assets 2.8 59.1 61.9 Charter (6/26/20) Skyhook 1 Current LBRD Total Net Debt Capitalized Corporate Expense $27,188 29 (555) (584) $27,188 29 (555) (584) $27,188 29 (555) (584) $27,188 29 (555) (584) $27,188 29 (555) (584) $27,188 29 (555) (584) $27,188 29 (555) (584) GLIB Financial Assets Charter (6/26/20) LendingTree (Post-tax) $2,691 733 $2,691 733 $2,691 733 $2,691 733 $2,691 733 $2,691 733 $2,691 733 Evite Value 3 Pro Forma NOL Carryforward Value 21 132 (465) 114 (3,132) 115 21 132 (465) 114 (3,132) 115 21 132 (465) 114 (3,132) 115 21 132 (465) 114 (3,132) 115 21 132 (465) 114 (3,132) 115 21 132 (465) 114 (3,132) 115 21 132 (465) 114 (3,132) 115 Capitalized Corporate Expense NPV of RHC FY16-19 Settlement 4 5 Current GLIB Total Net Debt Synergies 6 Total Shares Outstanding Current LBRD Diluted Shares 7 (+) New LBRD Shares Issued (-) Shares that GLIB Owns in LBRD Pro Forma LBRD Shares Outstanding 183.1 61.9 (42.7) 202.3 183.1 61.9 (42.7) 202.3 183.1 61.9 (42.7) 202.3 183.1 61.9 (42.7) 202.3 183.1 61.9 (42.7) 202.3 183.1 61.9 (42.7) 202.3 183.1 61.9 (42.7) 202.3 LBRD Net Asset Value / Share $142.45 $142.45 $142.45 $142.45 $142.45 $142.45 $142.45 Source: FactSet (as of 6/26/20) Note: For illustrative purposes, we have analyzed the transaction assuming stock consideration; Charter valued at share price of $502.27 as of 6/26/20 on a pre-tax basis and LendingTree valued on a post-tax basis 1. 2. 3. 4. 5. 6. 7. Assumes the mid-point of Skyhook’s value based on DCF analysis with terminal range of 1.5x to 3.5x GCI TEV range informed from the average value of trading analysis, precedent transactions and discounted cash flow valuation analyses Assumes the mid-point of Evite’s value based on DCF analysis with terminal range of 1.25x to 2.25x Assumes 0.17% discount rate for RHC FY16-19 Settlement impact based on 1-year treasury rate on 6/26/20 Includes $178mm preferred stock and 1.75% exchangeable senior debenture valued on a trading value basis of $647mm as of 6/26/20; book value as of 3/31/20 of $477mm Assumes the mid-point of $3-5mm annual run-rate synergies at 6.75% WACC, 4% perpetuity growth rate and 24% LBRD effective tax rate, per GLIB management guidance Calculated using treasury stock method 8 Implied Accretion / Dilution (%) (0.1%) 0.2% 0.6% 0.8% 0.9% 1.3% 1.6% Pro Forma Net Asset Value / Share $142.30 $142.80 $143.29 $143.53 $143.78 $144.27 $144.76 PF Net Asset Value $28,788 $28,888 $28,988 $29,038 $29,088 $29,188 $29,288 GCI Value 22,500 2,600 2,700 2,750 2,800 2,900 3,000 Current LBRD Net Asset Value $26,077 $26,077 $26,077 $26,077 $26,077 $26,077 $26,077 GLIB Purchase Price $7,641 |
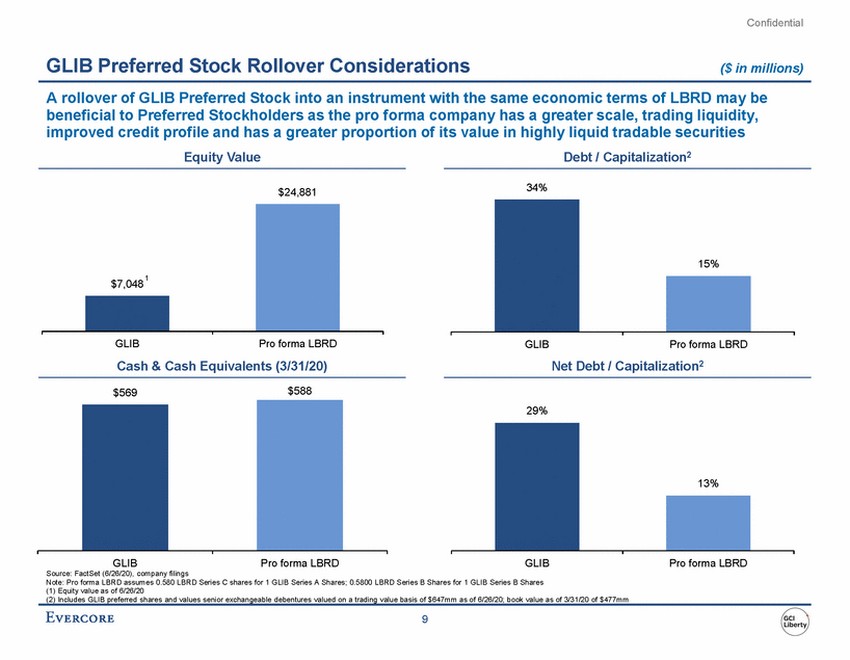 |
Confidential GLIB Preferred Stock Rollover Considerations ($ in millions) A rollover of GLIB Preferred Stock into an instrument with the same economic terms of LBRD may be beneficial to Preferred Stockholders as the pro forma company has a greater scale, trading liquidity, improved credit profile and has a greater proportion of its value in highly liquid tradable securities Equity Value Debt / Capitalization2 34% $24,881 $7,048 GLIB Pro forma LBRD GLIB Pro forma LBRD Net Debt / Capitalization2 Cash & Cash Equivalents (3/31/20) $588 $569 29% GLIB Pro forma LBRD GLIB Pro forma LBRD Source: FactSet (6/26/20), company filings Note: Pro forma LBRD assumes 0.580 LBRD Series C shares for 1 GLIB Series A Shares; 0.5800 LBRD Series B Shares for 1 GLIB Series B Shares (1) Equity value as of 6/26/20 (2) Includes GLIB preferred shares and values senior exchangeable debentures valued on a trading value basis of $647mm as of 6/26/20; book value as of 3/31/20 of $477mm 9 13% 1 15% |
 |
Confidential II. GLIB Preliminary Financial Analysis |
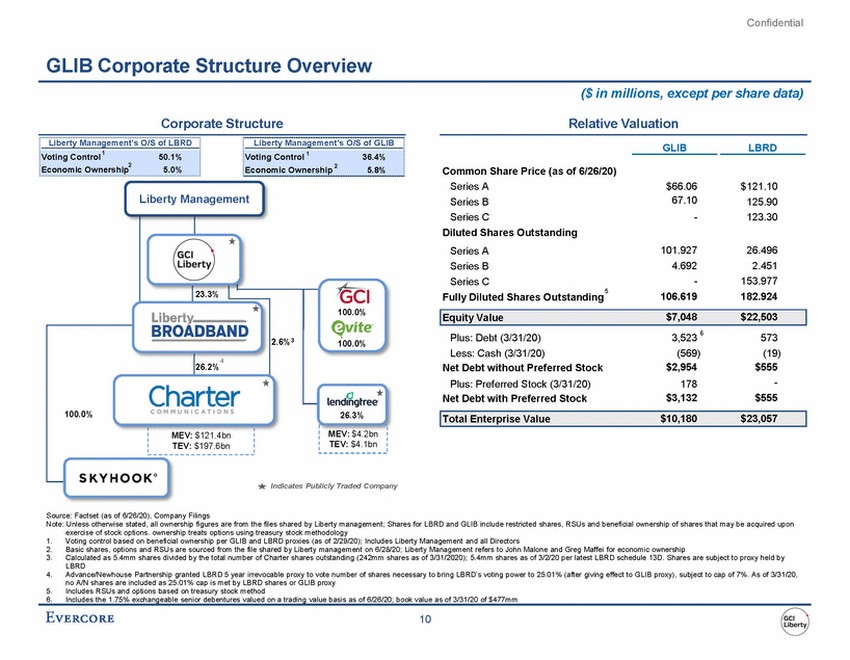 |
Confidential GLIB Corporate Structure Overview ($ in millions, except per share data) Corporate Structure Relative Valuation Liberty Management's O/S of LBRD Liberty Management's O/S of GLIB GLIB LBRD Common Share Price (as of 6/26/20) Series A Series B Series C Diluted Shares Outstanding Series A Series B Series C 5 Fully Diluted Shares Outstanding $66.06 67.10 - $121.10 125.90 123.30 Liberty Management 101.927 4.692 - 106.619 26.496 2.451 153.977 182.924 23.3% 100.0% 6 Plus: Debt (3/31/20) Less: Cash (3/31/20) Net Debt without Preferred Stock Plus: Preferred Stock (3/31/20) Net Debt with Preferred Stock 3,523 573 (19) $555 - $555 100.0% (569) $2,954 178 $3,132 4 26.2% 26.3% Indicates Publicly Traded Company Source: Factset (as of 6/26/20), Company Filings Note: Unless otherwise stated, all ownership figures are from the files shared by Liberty management; Shares for LBRD and GLIB include restricted shares, RSUs and beneficial ownership of shares that may be acquired upon exercise of stock options. ownership treats options using treasury stock methodology 1. 2. 3. Voting control based on beneficial ownership per GLIB and LBRD proxies (as of 2/29/20); Includes Liberty Management and all Directors Basic shares, options and RSUs are sourced from the file shared by Liberty management on 6/28/20; Liberty Management refers to John Malone and Greg Maffei for economic ownership Calculated as 5.4mm shares divided by the total number of Charter shares outstanding (242mm shares as of 3/31/2020); 5.4mm shares as of 3/2/20 per latest LBRD schedule 13D. Shares are subject to proxy held by LBRD Advance/Newhouse Partnership granted LBRD 5 year irrevocable proxy to vote number of shares necessary to bring LBRD’s voting power to 25.01% (after giving effect to GLIB proxy), subject to cap of 7%. As of 3/31/20, no A/N shares are included as 25.01% cap is met by LBRD shares or GLIB proxy Includes RSUs and options based on treasury stock method Includes the 1.75% exchangeable senior debentures valued on a trading value basis as of 6/26/20; book value as of 3/31/20 of $477mm 4. 5. 6. 10 MEV: $4.2bn TEV: $4.1bn MEV: $121.4bn TEV: $197.6bn Total Enterprise Value$10,180$23,057 100.0% Equity Value$7,048$22,503 2.6%3 Voting Control 1 50.1% 2 Economic Ownership5.0% Voting Control 1 36.4% 2 Economic Ownership5.8% |
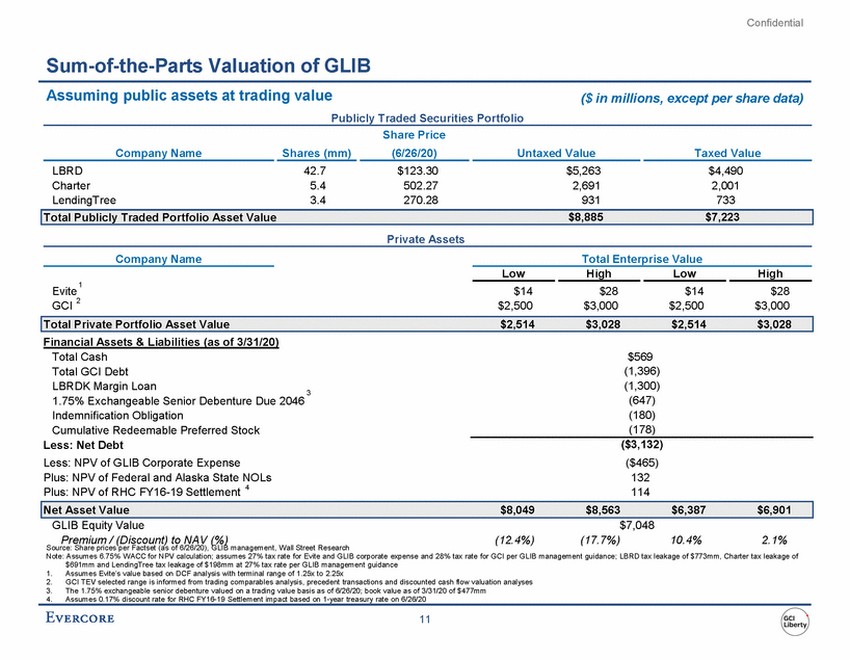 |
Confidential Sum-of-the-Parts Valuation of GLIB Assuming public assets at trading value ($ in millions, except per share data) Publicly Traded Securities Portfolio Share Price Company Name Shares (mm) (6/26/20) Untaxed Value Taxed Value LBRD Charter LendingTree 42.7 5.4 3.4 $123.30 502.27 270.28 $5,263 2,691 931 $4,490 2,001 733 Private Assets Company Name Total Enterprise Value Low High Low High 1 Evite $14 $2,500 $28 $3,000 $14 $2,500 $28 $3,000 GCI 2 Financial Assets & Liabilities (as of 3/31/20) Total Cash Total GCI Debt LBRDK Margin Loan 1.75% Exchangeable Senior Debenture Due 2046 Indemnification Obligation Cumulative Redeemable Preferred Stock Less: Net Debt Less: NPV of GLIB Corporate Expense Plus: NPV of Federal and Alaska State NOLs Plus: NPV of RHC FY16-19 Settlement 4 $569 (1,396) (1,300) (647) (180) (178) 3 ($3,132) ($465) 132 114 GLIB Equity Value $7,048 (17.7%) Premium / (Discount) to NAV (%) (12.4%) 10.4% 2.1% Source: Share prices per Factset (as of 6/26/20), GLIB management, Wall Street Research Note: Assumes 6.75% WACC for NPV calculation; assumes 27% tax rate for Evite and GLIB corporate expense and 28% tax rate for GCI per GLIB management guidance; LBRD tax leakage of $773mm, Charter tax leakage of $691mm and LendingTree tax leakage of $198mm at 27% tax rate per GLIB management guidance 1. 2. 3. 4. Assumes Evite’s value based on DCF analysis with terminal range of 1.25x to 2.25x GCI TEV selected range is informed from trading comparables analysis, precedent transactions and discounted cash flow valuation analyses The 1.75% exchangeable senior debenture valued on a trading value basis as of 6/26/20; book value as of 3/31/20 of $477mm Assumes 0.17% discount rate for RHC FY16-19 Settlement impact based on 1-year treasury rate on 6/26/20 11 Net Asset Value $8,049 $8,563 $6,387 $6,901 Total Private Portfolio Asset Value $2,514 $3,028 $2,514 $3,028 Total Publicly Traded Portfolio Asset Value $8,885 $7,223 |
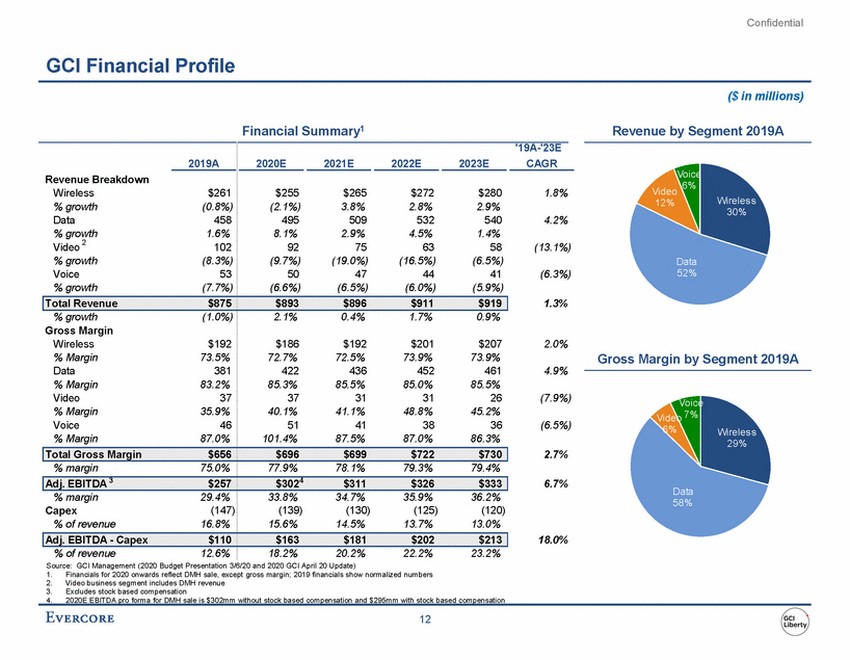 |
Confidential GCI Financial Profile ($ in millions) Financial Summary1 Revenue by Segment 2019A '19A-'23E CAGR 2019A 2020E 2021E 2022E 2023E Voic 6% Revenue Breakdown Wireless % growth Data % growth Video 2 % growth Voice % growth Vi 12% $261 (0.8%) 458 1.6% 102 (8.3%) 53 (7.7%) $255 (2.1%) 495 8.1% 92 (9.7%) 50 (6.6%) $265 3.8% 509 2.9% 75 (19.0%) 47 (6.5%) $272 2.8% 532 4.5% 63 (16.5%) 44 (6.0%) $280 2.9% 540 1.4% 58 (6.5%) 41 (5.9%) 1.8% 30% 4.2% (13.1%) Data 52% (6.3%) 1.3% % growth Gross Margin Wireless % Margin Data % Margin Video % Margin Voice % Margin (1.0%) 2.1% 0.4% 1.7% 0.9% $192 73.5% 381 83.2% 37 35.9% 46 87.0% $186 72.7% 422 85.3% 37 40.1% 51 101.4% $192 72.5% 436 85.5% 31 41.1% 41 87.5% $201 73.9% 452 85.0% 31 48.8% 38 87.0% $207 73.9% 461 85.5% 26 45.2% 36 86.3% 2.0% Gross Margin by Segment 2019A 4.9% (7.9%) Voic 7% Vi (6.5%) Wireles s 29% 2.7% % margin 75.0% 77.9% 78.1% 79.3% 79.4% 6.7% Data 58% % margin Capex % of revenue 29.4% (147) 16.8% 33.8% (139) 15.6% 34.7% (130) 14.5% 35.9% (125) 13.7% 36.2% (120) 13.0% 18.0% % of revenue 12.6% 18.2% 20.2% 22.2% 23.2% Source: GCI Management (2020 Budget Presentation 3/6/20 and 2020 GCI April 20 Update) 1. 2. 3. Financials for 2020 onwards reflect DMH sale, except gross margin; 2019 financials show normalized numbers Video business segment includes DMH revenue Excludes stock based compensation 4. 2020E EBITDA pro forma for DMH sale is $302mm without stock based compensation and $295mm with stock based compensation 12 Adj. EBITDA - Capex $110 $163 $181 $202 $213 Adj. EBITDA 3$257 $3024 $311 $326 $333 Total Gross Margin $656 $696 $699 $722 $730 Total Revenue $875 $893 $896 $911 $919 |
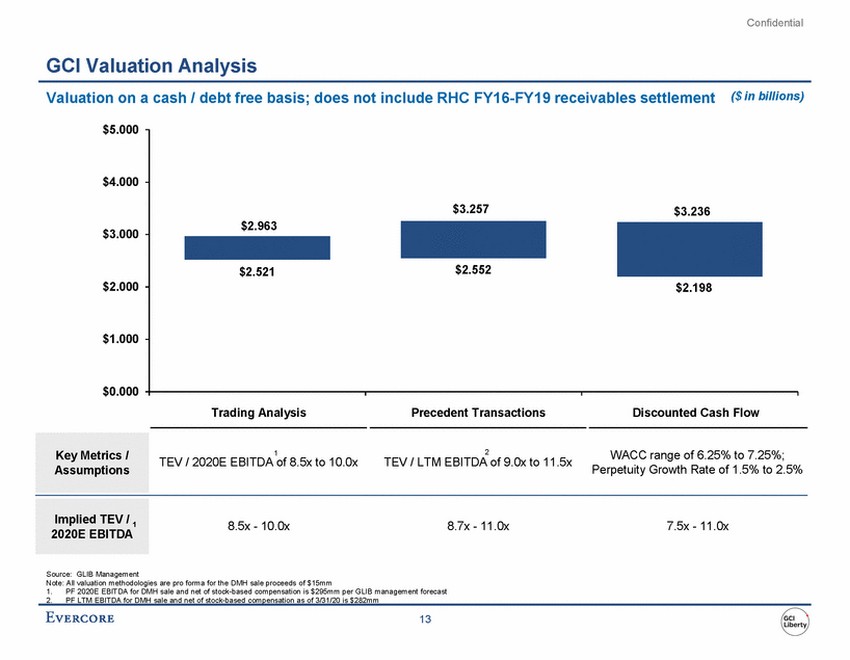 |
Confidential GCI Valuation Analysis Valuation on a cash / debt free basis; does not include RHC FY16-FY19 receivables settlement ($ in billions) $5.000 $4.000 $3.000 $2.000 $1.000 $0.000 2 TEV / LTM EBITDA of 9.0x to 11.5x 1 TEV / 2020E EBITDA of 8.5x to 10.0x WACC range of 6.25% to 7.25%; Perpetuity Growth Rate of 1.5% to 2.5% 8.5x - 10.0x 8.7x - 11.0x 7.5x - 11.0x Source: GLIB Management Note: All valuation methodologies are pro forma for the DMH sale proceeds of $15mm 1. PF 2020E EBITDA for DMH sale and net of stock-based compensation is $295mm per GLIB management forecast 2. PF LTM EBITDA for DMH sale and net of stock-based compensation as of 3/31/20 is $282mm 13 Implied TEV / 1 2020E EBITDA Key Metrics / Assumptions $3.257$3.236 $2.963 $2.521$2.552 $2.198 Trading Analysis Precedent TransactionsDiscounted Cash Flow |
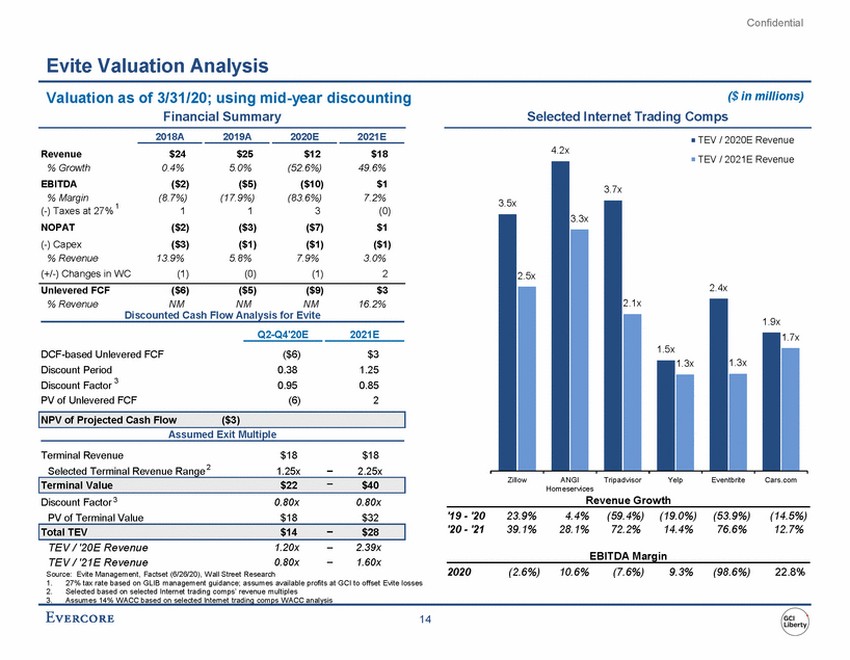 |
Confidential Evite Valuation Analysis Valuation as of 3/31/20; using mid-year discounting Financial Summary ($ in millions) Selected Internet Trading Comps 2018A 2019A 2020E 2021E TEV / 2020E Revenue TEV / 2021E Revenue 4.2x Revenue % Growth EBITDA $24 0.4% ($2) (8.7%) 1 ($2) ($3) 13.9% (1) $25 5.0% ($5) (17.9%) 1 ($3) ($1) 5.8% (0) $12 (52.6%) ($10) (83.6%) 3 ($7) ($1) 7.9% (1) $18 49.6% $1 7.2% (0) $1 ($1) 3.0% 2 % Margin (-) Taxes at 27% 1 NOPAT (-) Capex % Revenue (+/-) Changes in WC Unlevered FCF % Revenue ($6) NM ($5) NM ($9) NM $3 16.2% Discounted Cash Flow Analysis for Evite Q2-Q4'20E 2021E DCF-based Unlevered FCF Discount Period Discount Factor 3 PV of Unlevered FCF ($6) 0.38 0.95 (6) $3 1.25 0.85 2 Assumed Exit Multiple Terminal Revenue Selected Terminal Revenue Range 2 $18 1.25x $18 2.25x Zillow ANGI Homeservices Tripadvisor Yelp Eventbrite Cars.com Revenue Growth Discount Factor 3 PV of Terminal Value 0.80x $18 0.80x $32 '19 - '20 '20 - '21 23.9% 39.1% 4.4% 28.1% (59.4%) 72.2% (19.0%) 14.4% (53.9%) 76.6% (14.5%) 12.7% TEV / '20E Revenue TEV / '21E Revenue 1.20x 0.80x 2.39x 1.60x EBITDA Margin 2020 (2.6%) 10.6% (7.6%) 9.3% (98.6%) 22.8% Source: Evite Management, Factset (6/26/20), Wall Street Research 1. 2. 27% tax rate based on GLIB management guidance; assumes available profits at GCI to offset Evite losses Selected based on selected Internet trading comps’ revenue multiples 3. Assumes 14% W ACC based on selected Internet trading comps W ACC analysis 14 Total TEV$14$28 Terminal Value$22$40 NPV of Projected Cash Flow($3) 3.5x 3.7x 3.3x 2.4x 2.5x 2.1x 1.9x 1.5x 1.3x 1.7x 1.3x |
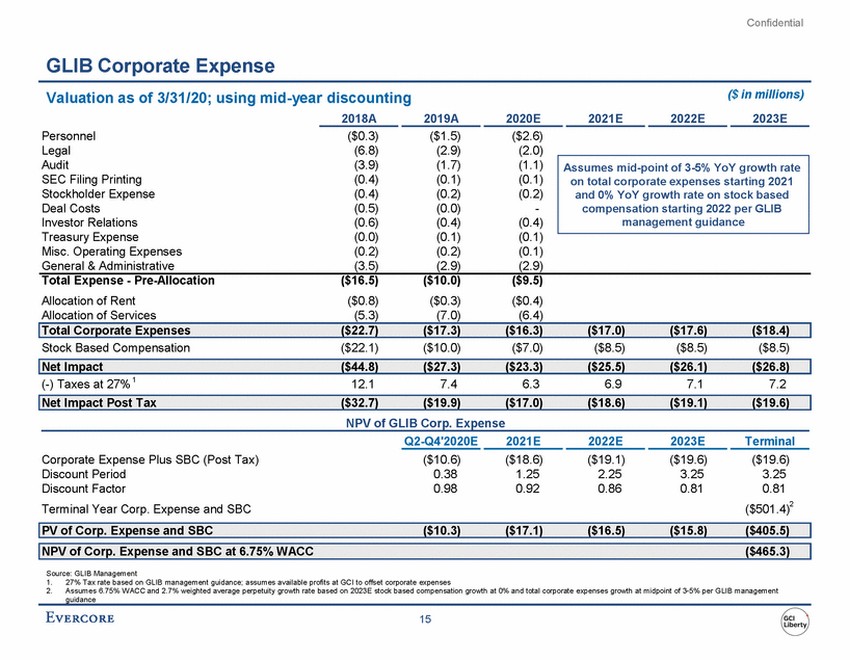 |
Confidential GLIB Corporate Expense ($ in millions) Valuation as of 3/31/20; using mid-year discounting 2018A 2019A 2020E 2021E 2022E 2023E Personnel Legal Audit SEC Filing Printing Stockholder Expense Deal Costs Investor Relations Treasury Expense Misc. Operating Expenses General & Administrative ($0.3) (6.8) (3.9) (0.4) (0.4) (0.5) (0.6) (0.0) (0.2) (3.5) ($1.5) (2.9) (1.7) (0.1) (0.2) (0.0) (0.4) (0.1) (0.2) (2.9) ($2.6) (2.0) (1.1) (0.1) (0.2) - (0.4) (0.1) (0.1) (2.9) Total Expense - Pre-Allocation Allocation of Rent Allocation of Services ($16.5) ($0.8) (5.3) ($10.0) ($0.3) (7.0) ($9.5) ($0.4) (6.4) Stock Based Compensation ($22.1) ($10.0) ($7.0) ($8.5) ($8.5) ($8.5) (-) Taxes at 27% 1 12.1 7.4 6.3 6.9 7.1 7.2 NPV of GLIB Corp. Expense Q2-Q4'2020E 2021E 2022E 2023E Terminal Corporate Expense Plus SBC (Post Tax) Discount Period Discount Factor Terminal Year Corp. Expense and SBC ($10.6) 0.38 0.98 ($18.6) 1.25 0.92 ($19.1) 2.25 0.86 ($19.6) 3.25 0.81 ($19.6) 3.25 0.81 ($501.4)2 Source: GLIB Management 1. 2. 27% Tax rate based on GLIB management guidance; assumes available profits at GCI to offset corporate expenses Assumes 6.75% WACC and 2.7% weighted average perpetuity growth rate based on 2023E stock based compensation growth at 0% and total corporate expenses growth at midpoint of 3-5% per GLIB management guidance 15 NPV of Corp. Expense and SBC at 6.75% WACC ($465.3) PV of Corp. Expense and SBC ($10.3) ($17.1) ($16.5) ($15.8) ($405.5) Net Impact Post Tax ($32.7) ($19.9) ($17.0) ($18.6) ($19.1) ($19.6) Net Impact ($44.8) ($27.3) ($23.3) ($25.5) ($26.1) ($26.8) Total Corporate Expenses ($22.7) ($17.3) ($16.3) ($17.0) ($17.6) ($18.4) Assumes mid-point of 3-5% YoY growth rate on total corporate expenses starting 2021 and 0% YoY growth rate on stock based compensation starting 2022 per GLIB management guidance |
 |
Confidential III. LBRD Preliminary Financial Analysis |
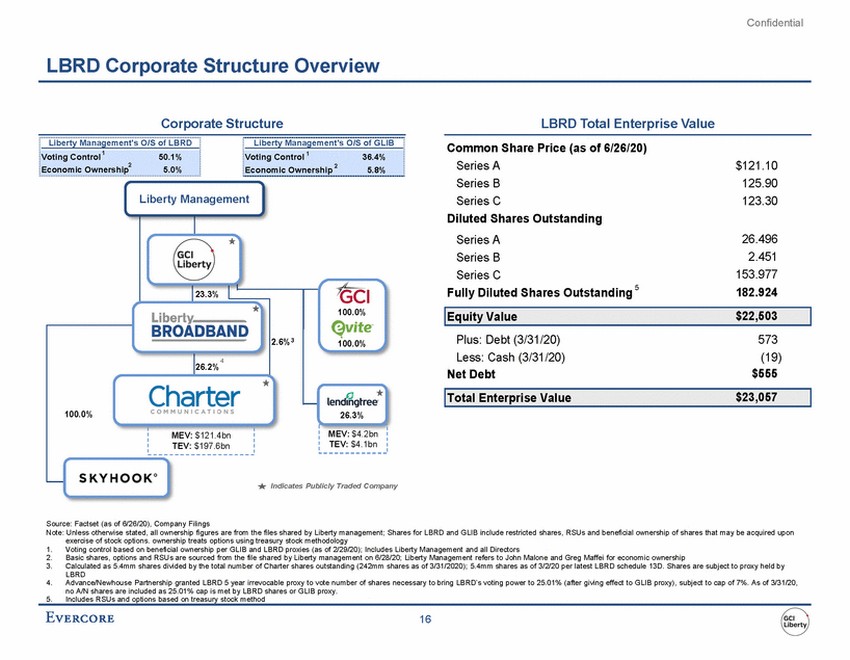 |
Confidential LBRD Corporate Structure Overview Corporate Structure LBRD Total Enterprise Value Liberty Management's O/S of LBRD Liberty Management's O/S of GLIB Common Share Price (as of 6/26/20) Series A Series B Series C Diluted Shares Outstanding Series A Series B Series C Fully Diluted Shares Outstanding 5 $121.10 125.90 123.30 2 Liberty Management 26.496 2.451 153.977 182.924 23.3% 100.0% Plus: Debt (3/31/20) Less: Cash (3/31/20) Net Debt 573 (19) $555 100.0% 4 26.2% 26.3% Indicates Publicly Traded Company Source: Factset (as of 6/26/20), Company Filings Note: Unless otherwise stated, all ownership figures are from the files shared by Liberty management; Shares for LBRD and GLIB include restricted shares, RSUs and beneficial ownership of shares that may be acquired upon exercise of stock options. ownership treats options using treasury stock methodology 1. 2. 3. Voting control based on beneficial ownership per GLIB and LBRD proxies (as of 2/29/20); Includes Liberty Management and all Directors Basic shares, options and RSUs are sourced from the file shared by Liberty management on 6/28/20; Liberty Management refers to John Malone and Greg Maffei for economic ownership Calculated as 5.4mm shares divided by the total number of Charter shares outstanding (242mm shares as of 3/31/2020); 5.4mm shares as of 3/2/20 per latest LBRD schedule 13D. Shares are subject to proxy held by LBRD Advance/Newhouse Partnership granted LBRD 5 year irrevocable proxy to vote number of shares necessary to bring LBRD’s voting power to 25.01% (after giving effect to GLIB proxy), subject to cap of 7%. As of 3/31/20, no A/N shares are included as 25.01% cap is met by LBRD shares or GLIB proxy. Includes RSUs and options based on treasury stock method 4. 5. 16 MEV: $4.2bn TEV: $4.1bn MEV: $121.4bn TEV: $197.6bn Total Enterprise Value$23,057 100.0% Equity Value$22,503 2.6%3 Voting Control 1 50.1% Economic Ownership5.0% Voting Control 1 36.4% Economic Ownership 2 5.8% |
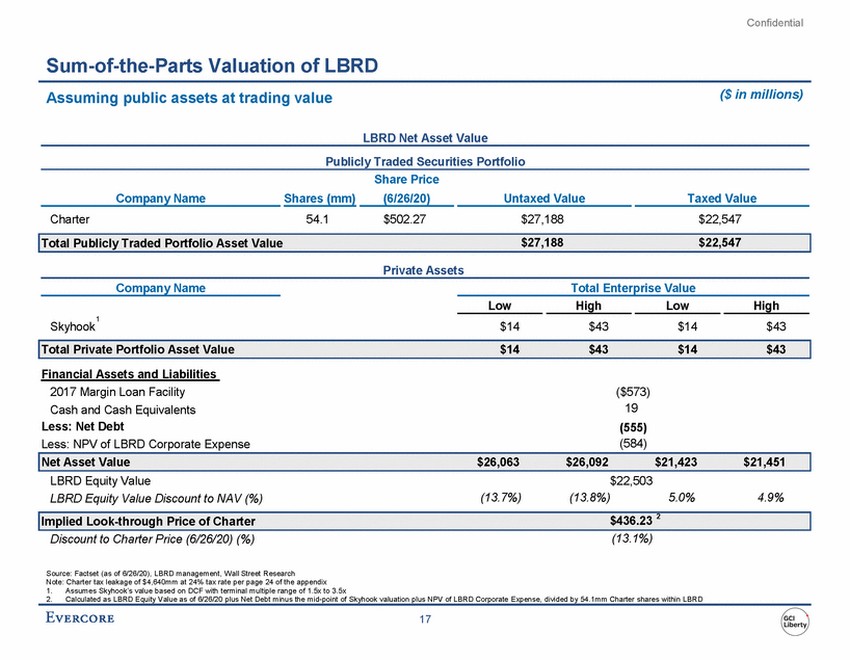 |
Confidential Sum-of-the-Parts Valuation of LBRD ($ in millions) Assuming public assets at trading value LBRD Net Asset Value Publicly Traded Securities Portfolio Share Price Company Name Shares (mm) (6/26/20) Untaxed Value Taxed Value Charter 54.1 $502.27 $27,188 $22,547 Private Assets Company Name Total Enterprise Value Low High Low High 1 Skyhook $14 $43 $14 $43 Financial Assets and Liabilities 2017 Margin Loan Facility Cash and Cash Equivalents Less: Net Debt Less: NPV of LBRD Corporate Expense ($573) 19 (555) (584) LBRD Equity Value LBRD Equity Value Discount to NAV (%) $22,503 (13.8%) (13.7%) 5.0% 4.9% (13.1%) Discount to Charter Price (6/26/20) (%) Source: Factset (as of 6/26/20), LBRD management, Wall Street Research Note: Charter tax leakage of $4,640mm at 24% tax rate per page 24 of the appendix 1. 2. Assumes Skyhook’s value based on DCF with terminal multiple range of 1.5x to 3.5x Calculated as LBRD Equity Value as of 6/26/20 plus Net Debt minus the mid-point of Skyhook valuation plus NPV of LBRD Corporate Expense, divided by 54.1mm Charter shares within LBRD 17 Implied Look-through Price of Charter$436.23 2 Net Asset Value$26,063$26,092$21,423$21,451 Total Private Portfolio Asset Value$14$43$14$43 Total Publicly Traded Portfolio Asset Value$27,188$22,547 |
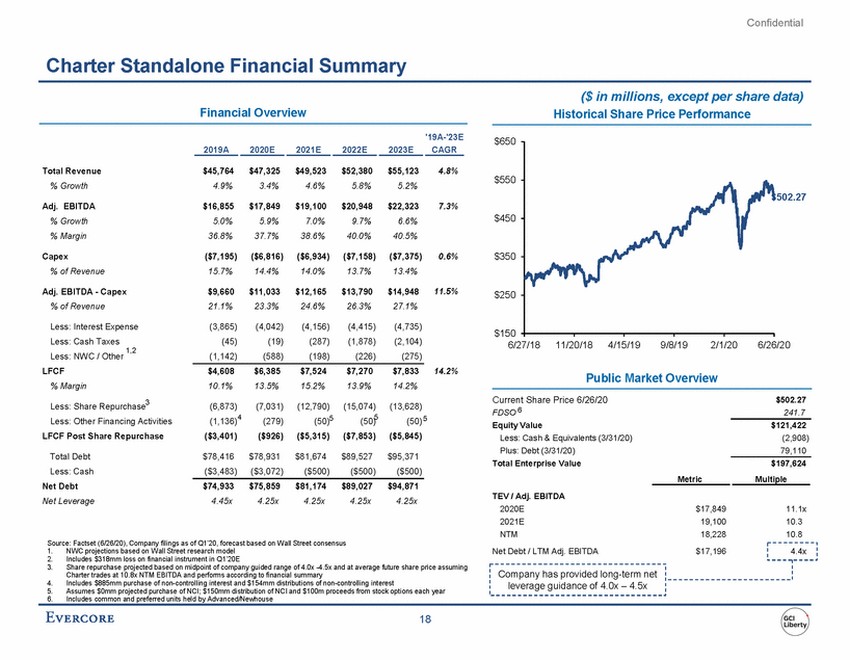 |
Confidential Charter Standalone Financial Summary ($ in millions, except per share data) Historical Share Price Performance Financial Overview '19A-'23E CAGR $650 2019A 2020E 2021E 2022E 2023E Total Revenue % Growth $45,764 4.9% $47,325 3.4% $49,523 4.6% $52,380 5.8% $55,123 5.2% 4.8% $550 $502.27 7.3% Adj. EBITDA % Growth % Margin $16,855 5.0% 36.8% $17,849 5.9% 37.7% $19,100 7.0% 38.6% $20,948 9.7% 40.0% $22,323 6.6% 40.5% $450 Capex % of Revenue ($7,195) 15.7% ($6,816) 14.4% ($6,934) 14.0% ($7,158) 13.7% ($7,375) 13.4% 0.6% $350 Adj. EBITDA - Capex % of Revenue $9,660 21.1% $11,033 23.3% $12,165 24.6% $13,790 26.3% $14,948 27.1% 11.5% $250 Less: Interest Expense Less: Cash Taxes 1,2 (3,865) (45) (1,142) (4,042) (19) (588) (4,156) (287) (198) (4,415) (1,878) (226) (4,735) (2,104) (275) $150 6/27/18 11/20/18 4/15/19 9/8/19 2/1/20 6/26/20 Less: NWC / Other LFCF % Margin Less: Share Repurchase3 Less: Other Financing Activities LFCF Post Share Repurchase 14.2% $4,608 10.1% $6,385 13.5% $7,524 15.2% $7,270 13.9% $7,833 14.2% Public Market Overview Current Share Price 6/26/20 FDSO 6 Equity Value Less: Cash & Equivalents (3/31/20) Plus: Debt (3/31/20) Total Enterprise Value $502.27 241.7 (6,873) (1,136)4 ($3,401) (7,031) (279) ($926) (12,790) (50)5 ($5,315) (15,074) (50)5 ($7,853) (13,628) (50) 5 ($5,845) $121,422 (2,908) 79,110 Total Debt Less: Cash Net Debt Net Leverage $78,416 ($3,483) $78,931 ($3,072) $81,674 ($500) $89,527 ($500) $95,371 ($500) $197,624 Multiple Metric $74,933 4.45x $75,859 4.25x $81,174 4.25x $89,027 4.25x $94,871 4.25x TEV / Adj. EBITDA 2020E 2021E NTM $17,849 19,100 18,228 11.1x 10.3 10.8 Source: Factset (6/26/20), Company filings as of Q1’20, forecast based on Wall Street consensus 1. 2. 3. NWC projections based on Wall Street research model Includes $318mm loss on financial instrument in Q1’20E Share repurchase projected based on midpoint of company guided range of 4.0x -4.5x and at average future share price assuming Charter trades at 10.8x NTM EBITDA and performs according to financial summary Includes $885mm purchase of non-controlling interest and $154mm distributions of non-controlling interest Assumes $0mm projected purchase of NCI; $150mm distribution of NCI and $100m proceeds from stock options each year Includes common and preferred units held by Advanced/Newhouse 4. 5. 6. 18 Net Debt / LTM Adj. EBITDA $17,196 4.4x Company has provided long-term net leverage guidance of 4.0x – 4.5x |
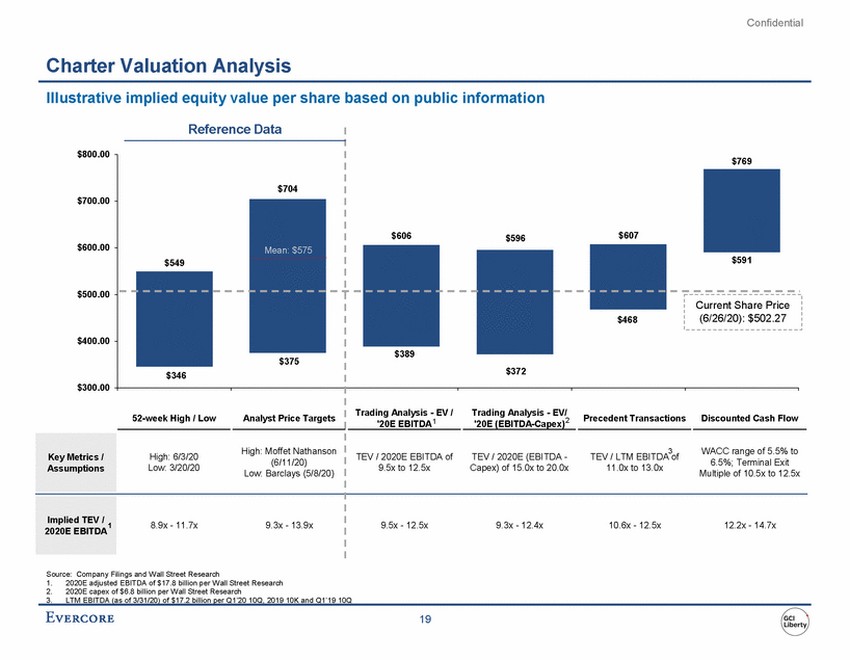 |
Confidential Charter Valuation Analysis Illustrative implied equity value per share based on public information $800.00 $389 $300.00 '20E (EBITDA-Capex)2 3 6.5%; Terminal Exit 2020E EBITDA Source: Company Filings and Wall Street Research 1. 2. 2020E adjusted EBITDA of $17.8 billion per Wall Street Research 2020E capex of $6.8 billion per Wall Street Research 3. LTM EBITDA (as of 3/31/20) of $17.2 billion per Q1’20 10Q, 2019 10K and Q1’19 10Q 19 Reference Data $769 $606$596$607 $704 $700.00 $600.00 $500.00 $400.00 $549 Mean: $575 $591 $468 $375 $372 $346 52-week High / Low Analyst Price Targets Trading Analysis - EV / '20E EBITDA 1 Trading Analysis - EV/ Precedent TransactionsDiscounted Cash Flow High: 6/3/20High: Moffet Nathanson (6/11/20) Low: 3/20/20Low: Barclays (5/8/20) TEV / 2020E EBITDA ofTEV / 2020E (EBITDA -TEV / LTM EBITDA ofWACC range of 5.5% to 9.5x to 12.5xCapex) of 15.0x to 20.0x11.0x to 13.0xMultiple of 10.5x to 12.5x Key Metrics / Assumptions Implied TEV / 1 8.9x - 11.7x9.3x - 13.9x 9.5x - 12.5x9.3x - 12.4x10.6x - 12.5x12.2x - 14.7x Current Share Price (6/26/20): $502.27 |
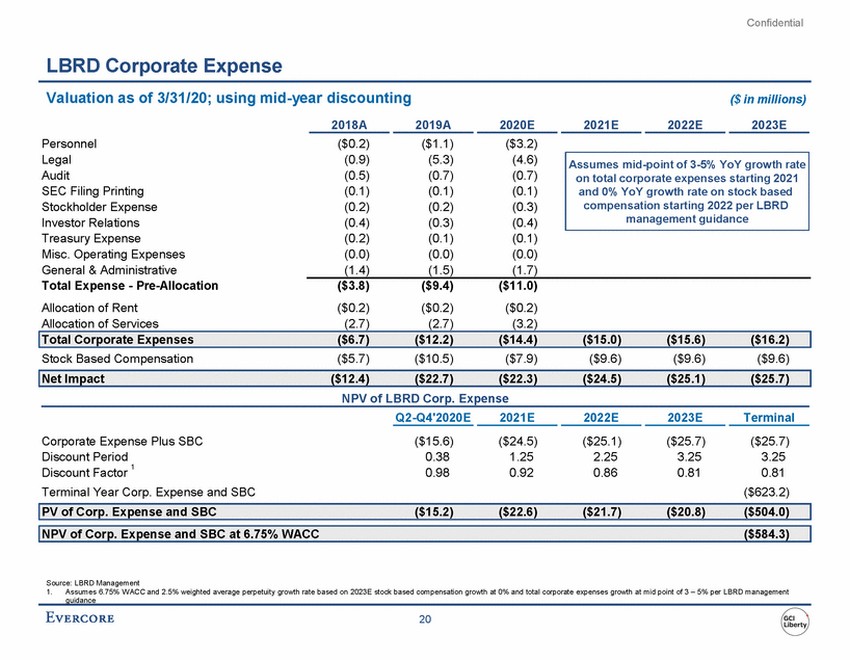 |
Confidential LBRD Corporate Expense Valuation as of 3/31/20; using mid-year discounting ($ in millions) 2018A 2019A 2020E 2021E 2022E 2023E Personnel Legal Audit SEC Filing Printing Stockholder Expense Investor Relations Treasury Expense Misc. Operating Expenses General & Administrative Total Expense - Pre-Allocation Allocation of Rent Allocation of Services ($0.2) (0.9) (0.5) (0.1) (0.2) (0.4) (0.2) (0.0) (1.4) ($1.1) (5.3) (0.7) (0.1) (0.2) (0.3) (0.1) (0.0) (1.5) ($3.2) (4.6) (0.7) (0.1) (0.3) (0.4) (0.1) (0.0) (1.7) ($3.8) ($0.2) (2.7) ($9.4) ($0.2) (2.7) ($11.0) ($0.2) (3.2) Stock Based Compensation ($5.7) ($10.5) ($7.9) ($9.6) ($9.6) ($9.6) NPV of LBRD Corp. Expense Q2-Q4'2020E 2021E 2022E 2023E Terminal Corporate Expense Plus SBC Discount Period ($15.6) 0.38 0.98 ($24.5) 1.25 0.92 ($25.1) 2.25 0.86 ($25.7) 3.25 0.81 ($25.7) 3.25 0.81 ($623.2) 1 Discount Factor Terminal Year Corp. Expense and SBC Source: LBRD Management 1. Assumes 6.75% WACC and 2.5% weighted average perpetuity growth rate based on 2023E stock based compensation growth at 0% and total corporate expenses growth at mid point of 3 – 5% per LBRD management guidance 20 NPV of Corp. Expense and SBC at 6.75% WACC($584.3) PV of Corp. Expense and SBC($15.2)($22.6)($21.7)($20.8)($504.0) Net Impact($12.4)($22.7)($22.3)($24.5)($25.1)($25.7) Total Corporate Expenses($6.7)($12.2)($14.4)($15.0)($15.6)($16.2) Assumes mid-point of 3-5% YoY growth rate on total corporate expenses starting 2021 and 0% YoY growth rate on stock based compensation starting 2022 per LBRD management guidance |
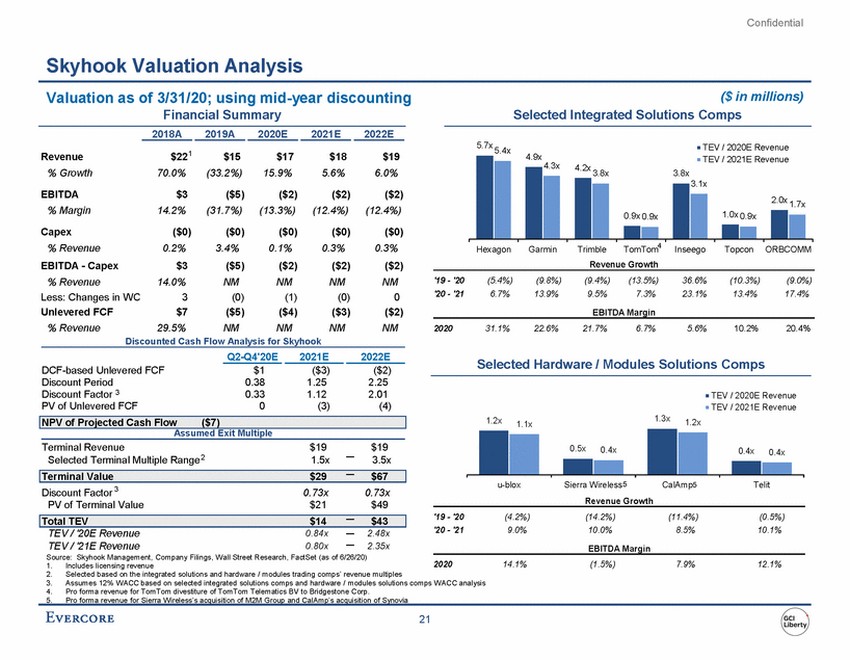 |
Confidential Skyhook Valuation Analysis Valuation as of 3/31/20; using mid-year discounting Financial Summary ($ in millions) Selected Integrated Solutions Comps 2018A 2019A 2020E 2021E 2022E 5.7x TEV / 2020E Revenue 5.4x $221 70.0% Revenue % Growth $15 (33.2%) $17 15.9% $18 5.6% $19 6.0% 4.9x TEV / 2021E Revenue 3.1x EBITDA % Margin $3 14.2% ($5) (31.7%) ($2) (13.3%) ($2) (12.4%) ($2) (12.4%) 1.7x Capex % Revenue EBITDA - Capex % Revenue Less: Changes in WC Unlevered FCF % Revenue ($0) 0.2% $3 14.0% 3 $7 29.5% ($0) 3.4% ($5) NM (0) ($5) NM ($0) 0.1% ($2) NM (1) ($4) NM ($0) 0.3% ($2) NM (0) ($3) NM ($0) 0.3% ($2) NM 0 ($2) NM TomTom4 Hexagon Garmin Trimble Inseego Topcon ORBCOMM Revenue Growth '19 - '20 '20 - '21 (5.4%) 6.7% (9.8%) 13.9% (9.4%) 9.5% (13.5%) 7.3% 36.6% 23.1% (10.3%) 13.4% (9.0%) 17.4% EBITDA Margin 2020 31.1% 22.6% 21.7% 6.7% 5.6% 10.2% 20.4% Discounted Cash Flow Analysis for Skyhook Q2-Q4'20E 2021E 2022E Selected Hardware / Modules Solutions Comps DCF-based Unlevered FCF Discount Period Discount Factor 3 PV of Unlevered FCF $1 0.38 0.33 0 ($3) 1.25 1.12 (3) ($2) 2.25 2.01 (4) TEV / 2020E Revenue TEV / 2021E Revenue 1.3x 1.2x 1.2x 1.1x Assumed Exit Multiple Terminal Revenue Selected Terminal Multiple Range 2 $19 1.5x $19 3.5x u-blox Sierra Wireless5 CalAmp5 Telit Discount Factor 3 PV of Terminal Value 0.73x $21 0.73x $49 Revenue Growth '19 - '20 '20 - '21 (4.2%) 9.0% (14.2%) 10.0% (11.4%) 8.5% (0.5%) 10.1% TEV / '20E Revenue TEV / '21E Revenue 0.84x 0.80x 2.48x 2.35x EBITDA Margin Source: Skyhook Management, Company Filings, Wall Street Research, FactSet (as of 6/26/20) 2020 14.1% (1.5%) 7.9% 12.1% 1. 2. 3. 4. Includes licensing revenue Selected based on the integrated solutions and hardware / modules trading comps’ revenue multiples Assumes 12% WACC based on selected integrated solutions comps and hardware / modules solutions comps WACC analysis Pro forma revenue for TomTom divestiture of TomTom Telematics BV to Bridgestone Corp. 5. Pro forma revenue for Sierra W ireless’s acquisition of M2M Group and CalAmp’s acquisition of Synovia 21 Total TEV$14$43 Terminal Value$29$67 0.4x0.4x 0.5x0.4x NPV of Projected Cash Flow($7) 4.3x 4.2x 3.8x 3.8x 0.9x 0.9x 2.0x 1.0x 0.9x |
 |
Confidential Appendix |
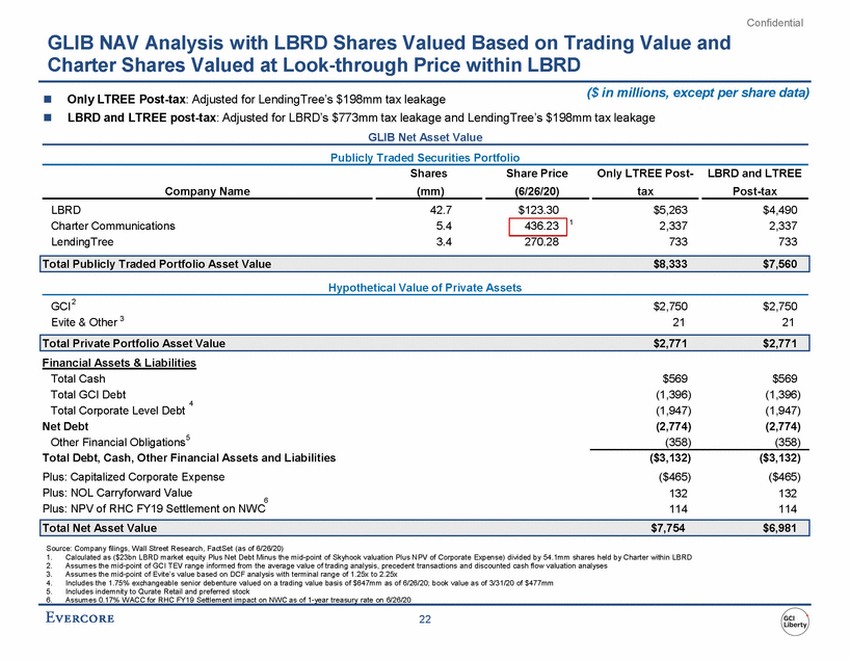 |
Confidential GLIB NAV Analysis with LBRD Shares Valued Based on Trading Value and Charter Shares Valued at Look-through Price within LBRD ($ in millions, except per share data) Only LTREE Post-tax: Adjusted for LendingTree’s $198mm tax leakage LBRD and LTREE post-tax: Adjusted for LBRD’s $773mm tax leakage and LendingTree’s $198mm tax leakage GLIB Net Asset Value Publicly Traded Securities Portfolio Shares Share Price Only LTREE Post-LBRD and LTREE Company Name (mm) (6/26/20) tax Post-tax LBRD Charter Communications LendingTree 42.7 5.4 3.4 $123.30 $5,263 2,337 733 $4,490 2,337 733 1 270.28 Hypothetical Value of Private Assets GCI2 Evite & Other 3 $2,750 21 $2,750 21 Financial Assets & Liabilities Total Cash Total GCI Debt Total Corporate Level Debt Net Debt $569 (1,396) (1,947) (2,774) (358) $569 (1,396) (1,947) (2,774) (358) 4 Other Financial Obligations5 Total Debt, Cash, Other Financial Assets and Liabilities Plus: Capitalized Corporate Expense Plus: NOL Carryforward Value ($3,132) ($465) 132 114 ($3,132) ($465) 132 114 6 Plus: NPV of RHC FY19 Settlement on NWC Source: Company filings, Wall Street Research, FactSet (as of 6/26/20) 1. 2. 3. 4. 5. Calculated as ($23bn LBRD market equity Plus Net Debt Minus the mid-point of Skyhook valuation Plus NPV of Corporate Expense) divided by 54.1mm shares held by Charter within LBRD Assumes the mid-point of GCI TEV range informed from the average value of trading analysis, precedent transactions and discounted cash flow valuation analyses Assumes the mid-point of Evite’s value based on DCF analysis with terminal range of 1.25x to 2.25x Includes the 1.75% exchangeable senior debenture valued on a trading value basis of $647mm as of 6/26/20; book value as of 3/31/20 of $477mm Includes indemnity to Qurate Retail and preferred stock 6. Assumes 0.17% W ACC for RHC FY19 Settlement impact on NW C as of 1-year treasury rate on 6/26/20 22 Total Net Asset Value$7,754$6,981 Total Private Portfolio Asset Value$2,771$2,771 Total Publicly Traded Portfolio Asset Value$8,333$7,560 436.23 |
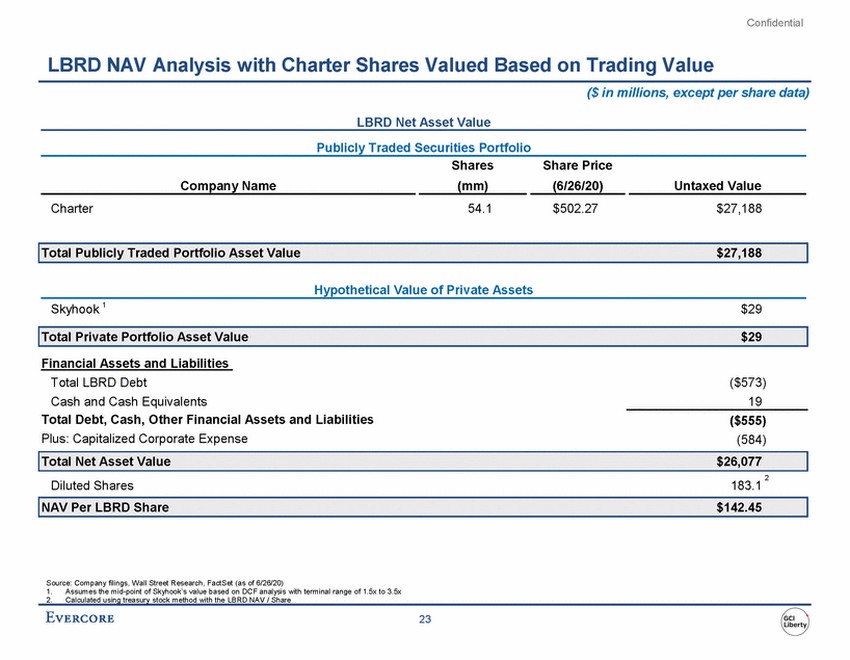 |
Confidential LBRD NAV Analysis with Charter Shares Valued Based on Trading Value ($ in millions, except per share data) LBRD Net Asset Value Publicly Traded Securities Portfolio Shares Share Price Company Name (mm) (6/26/20) Untaxed Value Charter 54.1 $502.27 $27,188 Hypothetical Value of Private Assets Skyhook 1 $29 Financial Assets and Liabilities Total LBRD Debt Cash and Cash Equivalents Total Debt, Cash, Other Financial Assets and Liabilities Plus: Capitalized Corporate Expense ($573) 19 ($555) (584) 2 Diluted Shares 183.1 Source: Company filings, Wall Street Research, FactSet (as of 6/26/20) 1. Assumes the mid-point of Skyhook’s value based on DCF analysis with terminal range of 1.5x to 3.5x 2. Calculated using treasury stock method with the LBRD NAV / Share 23 NAV Per LBRD Share $142.45 Total Net Asset Value $26,077 Total Private Portfolio Asset Value $29 Total Publicly Traded Portfolio Asset Value $27,188 |
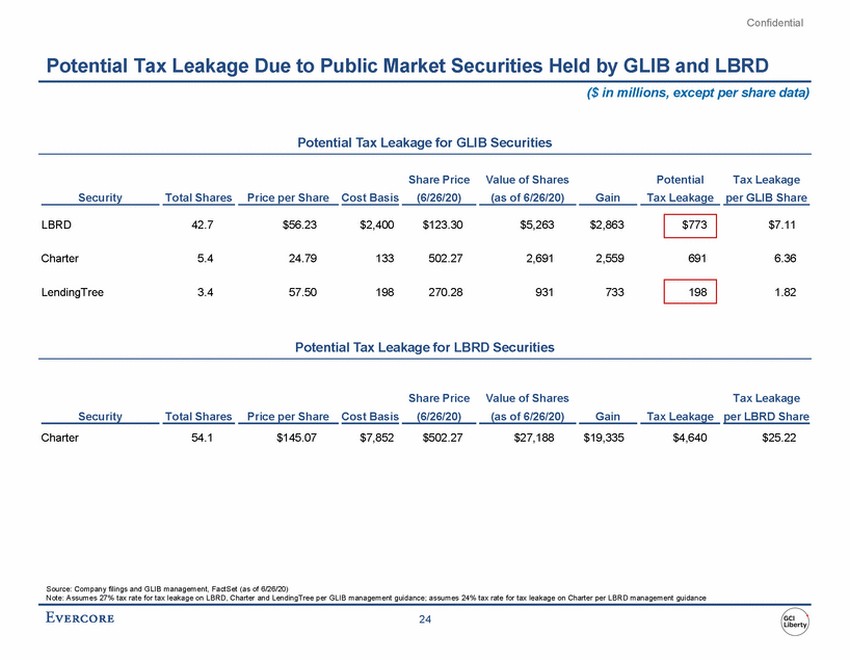 |
Confidential Potential Tax Leakage Due to Public Market Securities Held by GLIB and LBRD ($ in millions, except per share data) Potential Tax Leakage for GLIB Securities Share Price Value of Shares Potential Tax Leakage Security Total Shares Price per Share Cost Basis (6/26/20) (as of 6/26/20) Gain Tax Leakage per GLIB Share LBRD 42.7 $56.23 $2,400 $123.30 $5,263 $2,863 $7.11 Charter 5.4 24.79 133 502.27 2,691 2,559 691 6.36 LendingTree 3.4 57.50 198 270.28 931 733 1.82 Potential Tax Leakage for LBRD Securities Share Price Value of Shares Tax Leakage Security Total Shares Price per Share Cost Basis (6/26/20) (as of 6/26/20) Gain Tax Leakage per LBRD Share Charter 54.1 $145.07 $7,852 $502.27 $27,188 $19,335 $4,640 $25.22 Source: Company filings and GLIB management, FactSet (as of 6/26/20) Note: Assumes 27% tax rate for tax leakage on LBRD, Charter and LendingTree per GLIB management guidance; assumes 24% tax rate for tax leakage on Charter per LBRD management guidance 24 198 $773 |
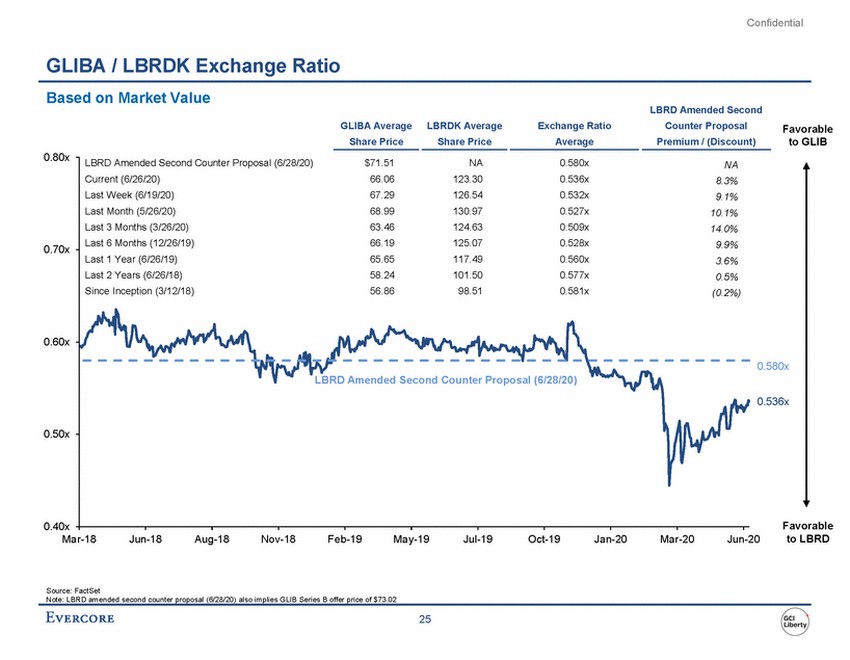 |
Confidential GLIBA / LBRDK Exchange Ratio Based on Market Value LBRD Amended Second Counter Proposal Premium / (Discount) GLIBA Average Share Price LBRDK Average Share Price Exchange Ratio Average Favorable to GLIB 0.80x 0.70x 0.60x 0.580x 0.536x 0.50x 0.40x Favorable to LBRD Mar-18 Jun-18 Aug-18 Nov-18 Feb-19 May-19 Jul-19 Oct-19 Jan-20 Mar-20 Jun-20 Source: FactSet Note: LBRD amended second counter proposal (6/28/20) also implies GLIB Series B offer price of $73.02 25 LBRD Amended Second Counter Proposal (6/28/20) $71.51 NA 0.580x NA Current (6/26/20) 66.06 123.30 0.536x 8.3% Last Week (6/19/20) 67.29 126.54 0.532x 9.1% Last Month (5/26/20) 68.99 130.97 0.527x 10.1% Last 3 Months (3/26/20) 63.46 124.63 0.509x 14.0% Last 6 Months (12/26/19) 66.19 125.07 0.528x 9.9% Last 1 Year (6/26/19) 65.65 117.49 0.560x 3.6% Last 2 Years (6/26/18) 58.24 101.50 0.577x 0.5% Since Inception (3/12/18) 56.86 98.51 0.581x (0.2%) LBRD Amended Second Counter Proposal (6/28/20) |
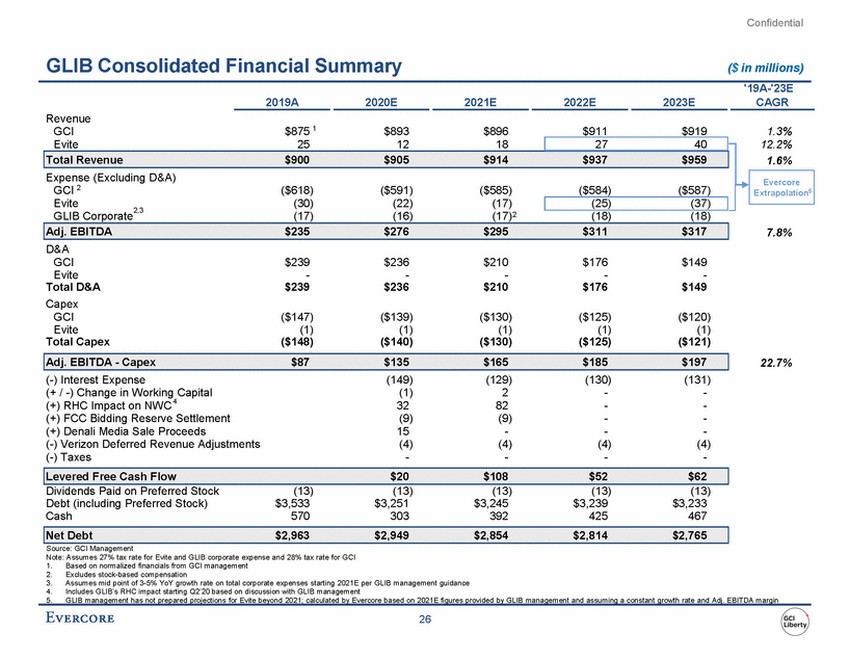 |
Confidential GLIB Consolidated Financial Summary ($ in millions) '19A-'23E 2019A 2020E 2021E 2022E 2023E CAGR Revenue GCI $875 1 $893 $896 $911 $919 1.3% 12.2% 1.6% Extrapolation5 2,3 GLIB Corporate (17) (16) (17)2 (18) (18) 7.8% D&A GCI Evite Total D&A Capex GCI Evite Total Capex $239 - $239 $236 - $236 $210 - $210 $176 - $176 $149 - $149 ($147) (1) ($148) ($139) (1) ($140) ($130) (1) ($130) ($125) (1) ($125) ($120) (1) ($121) 22.7% (-) Interest Expense (149) (1) 32 (9) 15 (4) - (129) 2 82 (9) - (4) - (130) - - - - (4) - (131) - - - - (4) - (+ / -) Change in Working Capital (+) RHC Impact on NWC 4 (+) FCC Bidding Reserve Settlement (+) Denali Media Sale Proceeds (-) Verizon Deferred Revenue Adjustments (-) Taxes Dividends Paid on Preferred Stock Debt (including Preferred Stock) Cash (13) $3,533 570 (13) $3,251 303 (13) $3,245 392 (13) $3,239 425 (13) $3,233 467 Source: GCI Management Note: Assumes 27% tax rate for Evite and GLIB corporate expense and 28% tax rate for GCI 1. 2. 3. 4. Based on normalized financials from GCI management Excludes stock-based compensation Assumes mid point of 3-5% YoY growth rate on total corporate expenses starting 2021E per GLIB management guidance Includes GLIB’s RHC impact starting Q2’20 based on discussion with GLIB management 5. GLIB management has not prepared projections for Evite beyond 2021; calculated by Evercore based on 2021E figures provided by GLIB management and assuming a constant growth rate and Adj. EBITDA margin 26 Net Debt$2,963$2,949$2,854$2,814$2,765 Levered Free Cash Flow$20$108$52$62 Adj. EBITDA - Capex$87$135$165$185$197 Adj. EBITDA$235$276$295$311$317 Evercore Evite251218 2740 Total Revenue$900$905$914$937$959 Expense (Excluding D&A) GCI 2($618)($591)($585)($584)($587) Evite(30)(22)(17) (25)(37) |
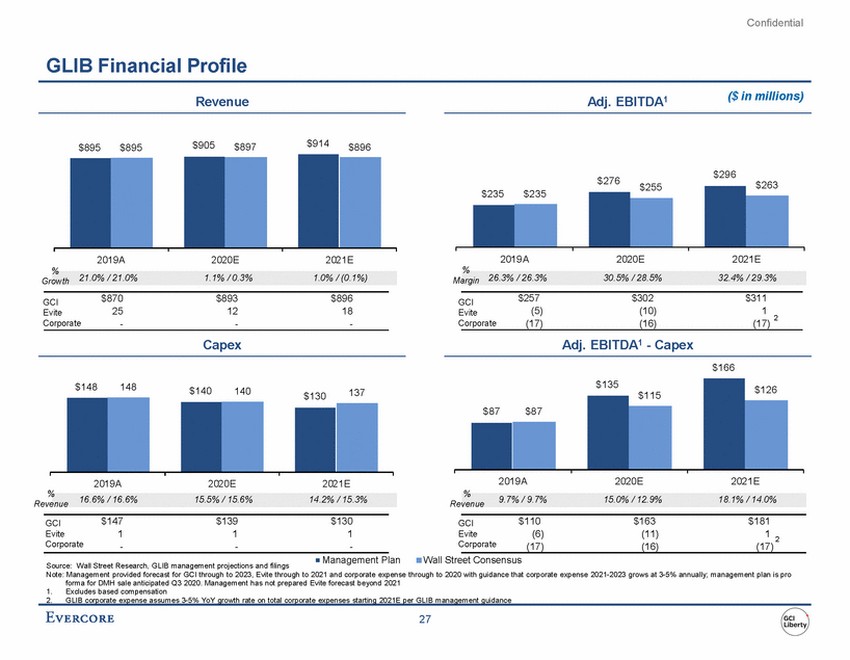 |
Confidential GLIB Financial Profile ($ in millions) Revenue Adj. EBITDA1 $914 $905 $897 $896 $895 $895 $296 $276 $263 $255 2019A 2020E 2021E 2019A 2020E 2021E % % 21.0% / 21.0% 1.1% / 0.3% 1.0% / (0.1%) 26.3% / 26.3% 30.5% / 28.5% 32.4% / 29.3% Margin Growth $870 25 - $893 12 - $896 18 - $257 (5) (17) $302 (10) (16) $311 1 (17) GCI Evite Corporate GCI Evite Corporate 2 Capex Adj. EBITDA1 - Capex $166 $148 148 $140 140 137 $115 $130 2019A 2020E 2021E 2019A 2020E 2021E % % 16.6% / 16.6% 15.5% / 15.6% 14.2% / 15.3% 9.7% / 9.7% 15.0% / 12.9% 18.1% / 14.0% Revenue Revenue $147 1 - $139 1 - $130 1 - $110 (6) (17) $163 (11) (16) $181 GCI Evite Corporate GCI Evite Corporate 1 2 (17) Management Plan Wall Street Consensus Source: Wall Street Research, GLIB management projections and filings Note: Management provided forecast for GCI through to 2023, Evite through to 2021 and corporate expense through to 2020 with guidance that corporate expense 2021-2023 grows at 3-5% annually; management plan is pro forma for DMH sale anticipated Q3 2020. Management has not prepared Evite forecast beyond 2021 1. Excludes based compensation 2. GLIB corporate expense assumes 3-5% YoY growth rate on total corporate expenses starting 2021E per GLIB management guidance 27 $135 $126 $87 $87 $235 $235 |
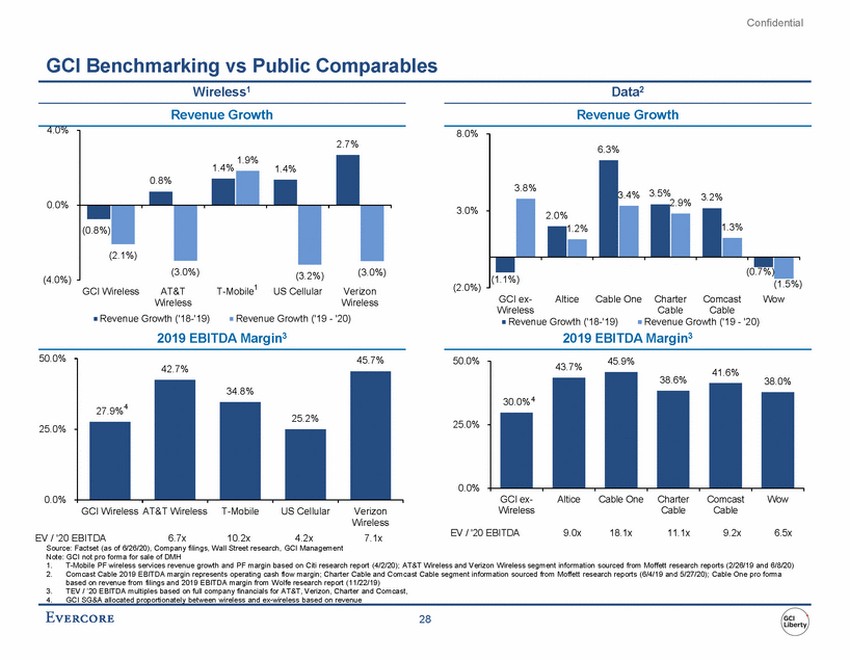 |
Confidential GCI Benchmarking vs Public Comparables Wireless1 Data2 Revenue Growth Revenue Growth 4.0% 8.0% 1.4% 1.4% 2.9% 0.0% 3.0% (0.7%) (4.0%) (1.1%) GCI ex-Wireless 5%) (2.0%) 1 GCI Wireless AT&T Wireless T-Mobile US Cellular Verizon Wireless Altice Cable OneCharter Cable Comcast Cable Wow Revenue Growth ('18-'19) Revenue Growth ('19 - '20) Revenue Growth ('18-'19) Revenue Growth ('19 - '20) 2019 EBITDA Margin3 2019 EBITDA Margin3 50.0% 50.0% 41.6% 38.6% 38.0% 27.9% 25.0% 25.0% 0.0% 0.0% GCI ex-Wireless Altice Cable One Charter Cable Comcast Cable Wow GCI Wireless AT&T Wireless T-Mobile US Cellular Verizon Wireless 7.1x EV / '20 EBITDA 9.0x 18.1x 11.1x 9.2x 6.5x EV / '20 EBITDA 6.7x 10.2x 4.2x Source: Factset (as of 6/26/20), Company filings, Wall Street research, GCI Management Note: GCI not pro forma for sale of DMH 1. 2. T-Mobile PF wireless services revenue growth and PF margin based on Citi research report (4/2/20); AT&T Wireless and Verizon Wireless segment information sourced from Moffett research reports (2/26/19 and 6/8/20) Comcast Cable 2019 EBITDA margin represents operating cash flow margin; Charter Cable and Comcast Cable segment information sourced from Moffett research reports (6/4/19 and 5/27/20); Cable One pro forma based on revenue from filings and 2019 EBITDA margin from Wolfe research report (11/22/19) TEV / ’20 EBITDA multiples based on full company financials for AT&T, Verizon, Charter and Comcast, GCI SG&A allocated proportionately between wireless and ex-wireless based on revenue 3. 4. 28 43.7% 45.9% 30.0% 4 45.7% 42.7% 4 34.8% 25.2% 6.3% 3.8% 3.4% 3.5%3.2% 2.0% 1.3% 1.2% (1. 2.7% 1.9% 0.8% (0.8%) (2.1%) (3.0%)(3.2%)(3.0%) |
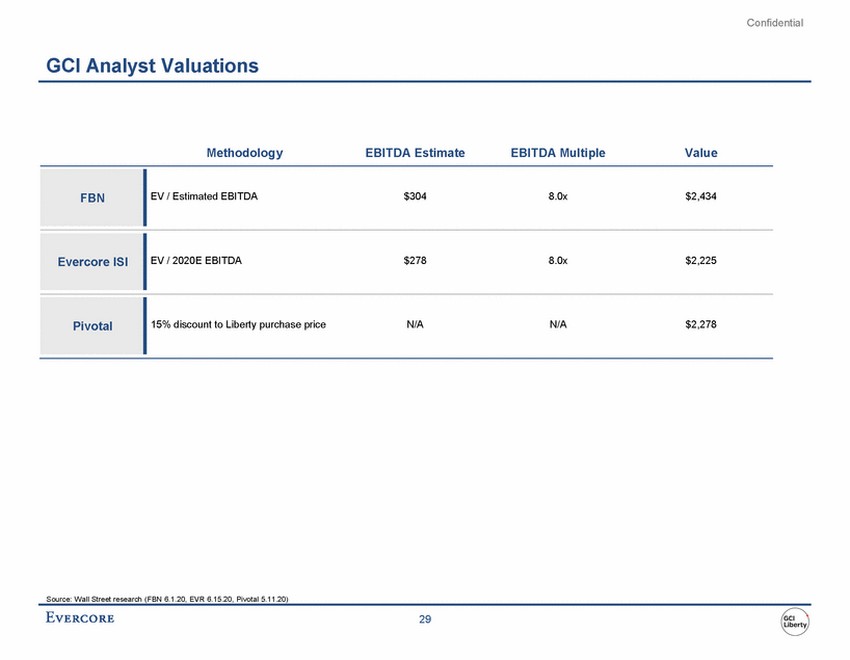 |
Confidential GCI Analyst Valuations Methodology EBITDA Estimate EBITDA Multiple Value Source: Wall Street research (FBN 6.1.20, EVR 6.15.20, Pivotal 5.11.20) 29 EV / Estimated EBITDA$3048.0x$2,434 FBN EV / 2020E EBITDA$2788.0x$2,225 Evercore ISI 15% discount to Liberty purchase priceN/AN/A$2,278 Pivotal |
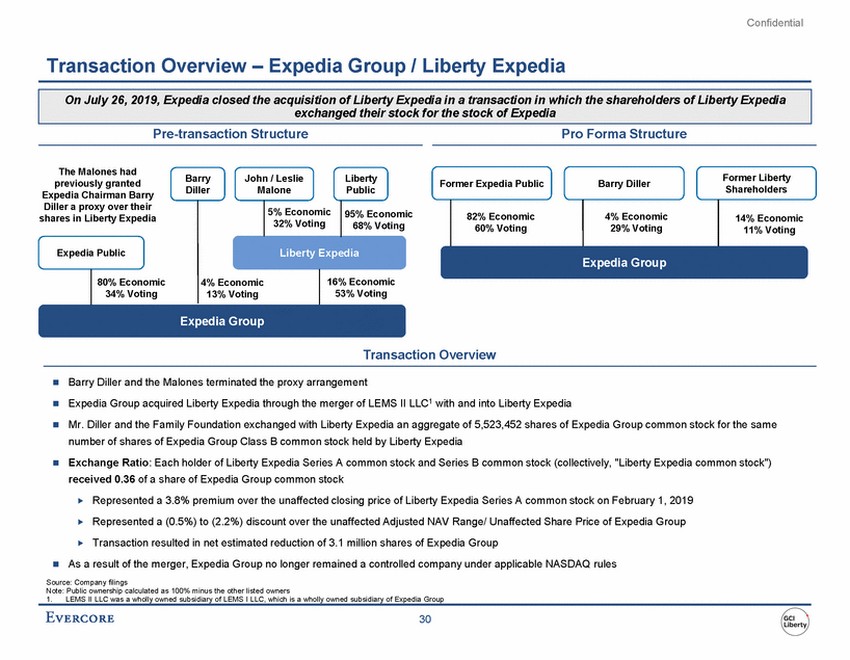 |
Confidential Transaction Overview – Expedia Group / Liberty Expedia Pre-transaction Structure Pro Forma Structure The Malones had previously granted Expedia Chairman Barry Diller a proxy over their shares in Liberty Expedia Barry Diller John / Leslie Malone Liberty Public Former Liberty Shareholders Former Expedia Public Barry Diller 5% Economic 32% Voting 95% Economic 68% Voting 82% Economic 60% Voting 4% Economic 29% Voting 14% Economic 11% Voting Expedia Public Liberty Expedia Expedia Group 80% Economic 34% Voting 16% Economic 53% Voting 4% Economic 13% Voting Expedia Group Transaction Overview Barry Diller and the Malones terminated the proxy arrangement Expedia Group acquired Liberty Expedia through the merger of LEMS II LLC1 with and into Liberty Expedia Mr. Diller and the Family Foundation exchanged with Liberty Expedia an aggregate of 5,523,452 shares of Expedia Group common stock for the same number of shares of Expedia Group Class B common stock held by Liberty Expedia Exchange Ratio: Each holder of Liberty Expedia Series A common stock and Series B common stock (collectively, "Liberty Expedia common stock") received 0.36 of a share of Expedia Group common stock Represented a 3.8% premium over the unaffected closing price of Liberty Expedia Series A common stock on February 1, 2019 Represented a (0.5%) to (2.2%) discount over the unaffected Adjusted NAV Range/ Unaffected Share Price of Expedia Group Transaction resulted in net estimated reduction of 3.1 million shares of Expedia Group As a result of the merger, Expedia Group no longer remained a controlled company under applicable NASDAQ rules Source: Company filings Note: Public ownership calculated as 100% minus the other listed owners 1. LEMS II LLC was a wholly owned subsidiary of LEMS I LLC, which is a wholly owned subsidiary of Expedia Group 30 On July 26, 2019, Expedia closed the acquisition of Liberty Expedia in a transaction in which the shareholders of Liberty Expedia exchanged their stock for the stock of Expedia |
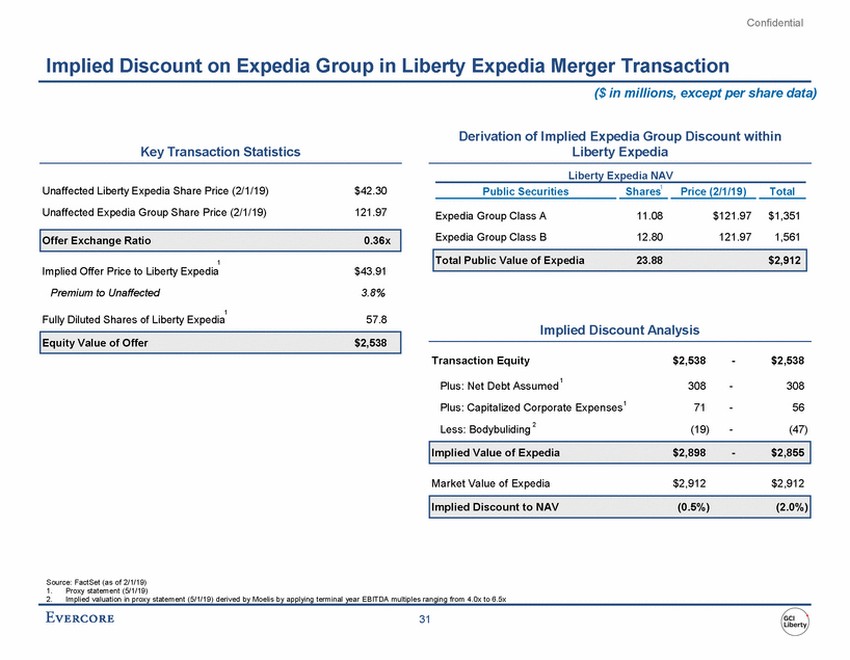 |
Confidential Implied Discount on Expedia Group in Liberty Expedia Merger Transaction ($ in millions, except per share data) Derivation of Implied Expedia Group Discount within Liberty Expedia Key Transaction Statistics Liberty Expedia NAV Shares1 Unaffected Liberty Expedia Share Price (2/1/19) Unaffected Expedia Group Share Price (2/1/19) $42.30 121.97 Public Securities Price (2/1/19) Total Expedia Group Class A Expedia Group Class B 11.08 12.80 $121.97 121.97 $1,351 1,561 1 Implied Offer Price to Liberty Expedia Premium to Unaffected $43.91 3.8% 1 Fully Diluted Shares of Liberty Expedia 57.8 Implied Discount Analysis Transaction Equity $2,538 - $2,538 1 Plus: Net Debt Assumed 308 71 (19) - - - 308 56 (47) Plus: Capitalized Corporate Expenses1 Less: Bodybuliding 2 Market Value of Expedia $2,912 $2,912 Source: FactSet (as of 2/1/19) 1. 2. Proxy statement (5/1/19) Implied valuation in proxy statement (5/1/19) derived by Moelis by applying terminal year EBITDA multiples ranging from 4.0x to 6.5x 31 Implied Discount to NAV (0.5%) (2.0%) Implied Value of Expedia $2,898 - $2,855 Equity Value of Offer$2,538 Total Public Value of Expedia23.88$2,912 Offer Exchange Ratio0.36x |
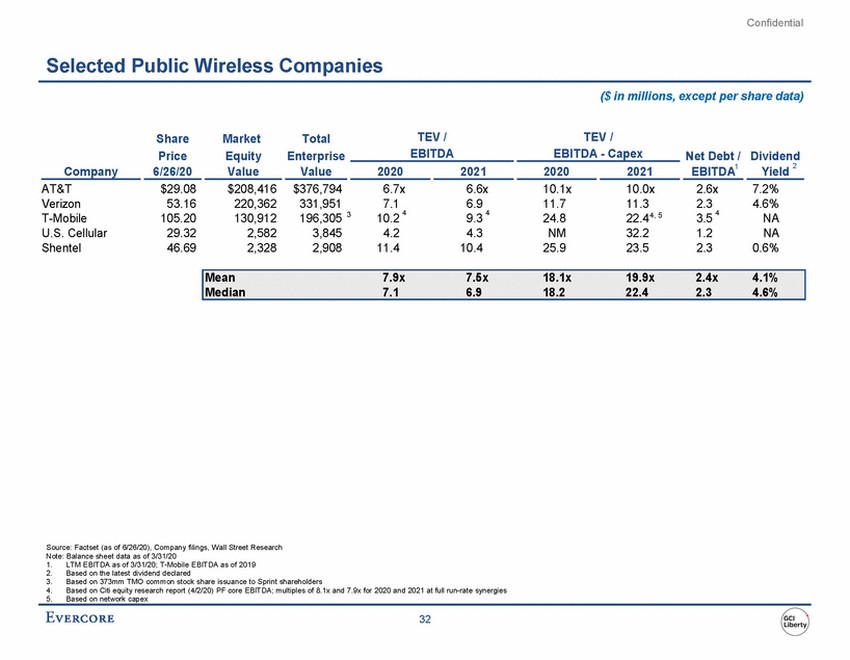 |
Confidential Selected Public Wireless Companies ($ in millions, except per share data) TEV / TEV / Share Market Total Enterprise EBITDA EBITDA - Capex Price Equity Net Debt / Dividend Company 6/26/20 Value Value 2020 2021 2020 2021 EBITDA1 Yield 2 AT&T Verizon T-Mobile U.S. Cellular Shentel $29.08 53.16 105.20 29.32 46.69 $208,416 220,362 130,912 2,582 2,328 $376,794 331,951 196,305 3,845 2,908 6.7x 6.6x 10.1x 11.7 24.8 NM 25.9 10.0x 11.3 2.6x 7.2% 4.6% NA NA 0.6% 7.1 10.2 4.2 11.4 6.9 9.3 4.3 10.4 2.3 3.5 1.2 2.3 4 4 4 3 4, 5 22.4 32.2 23.5 Source: Factset (as of 6/26/20), Company filings, Wall Street Research Note: Balance sheet data as of 3/31/20 1. 2. 3. 4. 5. LTM EBITDA as of 3/31/20; T-Mobile EBITDA as of 2019 Based on the latest dividend declared Based on 373mm TMO common stock share issuance to Sprint shareholders Based on Citi equity research report (4/2/20) PF core EBITDA; multiples of 8.1x and 7.9x for 2020 and 2021 at full run-rate synergies Based on network capex 32 Mean7.9x7.5x18.1x19.9x2.4x4.1% Median7.16.918.222.42.34.6% |
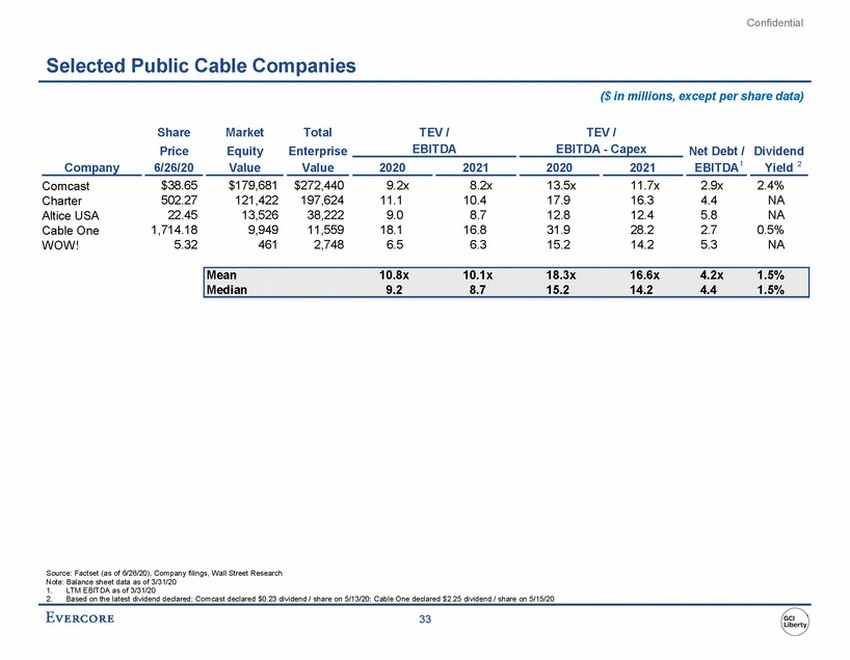 |
Confidential Selected Public Cable Companies ($ in millions, except per share data) Share Price Market Equity Total TEV / TEV / Enterprise EBITDA EBITDA - Capex Net Debt / Dividend Company 6/26/20 Value Value 2020 2021 2020 2021 EBITDA1 Yield 2 $38.65 502.27 22.45 1,714.18 5.32 $179,681 121,422 13,526 9,949 461 $272,440 197,624 38,222 11,559 2,748 9.2x 11.1 9.0 18.1 6.5 8.2x 10.4 8.7 16.8 6.3 13.5x 17.9 12.8 31.9 15.2 11.7x 16.3 12.4 28.2 14.2 2.9x 4.4 5.8 2.7 5.3 2.4% NA NA 0.5% NA Comcast Charter Altice USA Cable One WOW! Source: Factset (as of 6/26/20), Company filings, Wall Street Research Note: Balance sheet data as of 3/31/20 1. 2. LTM EBITDA as of 3/31/20 Based on the latest dividend declared; Comcast declared $0.23 dividend / share on 5/13/20; Cable One declared $2.25 dividend / share on 5/15/20 33 Mean 10.8x 10.1x 18.3x 16.6x 4.2x 1.5% Median 9.2 8.7 15.2 14.2 4.4 1.5% |
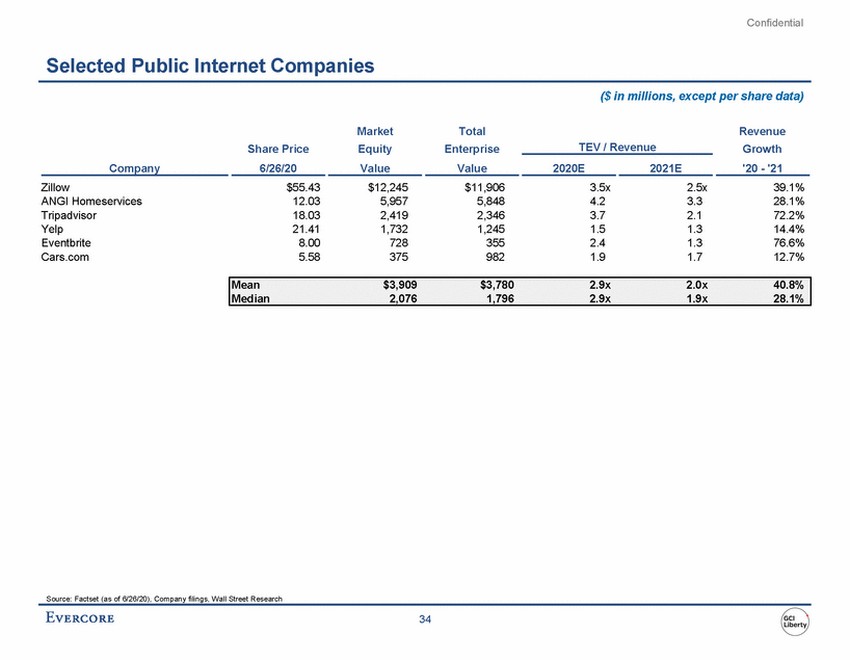 |
Confidential Selected Public Internet Companies ($ in millions, except per share data) Market Equity Total Enterprise Revenue Growth TEV / Revenue Share Price Company 6/26/20 Value Value 2020E 2021E '20 - '21 Zillow ANGI Homeservices Tripadvisor Yelp Eventbrite Cars.com $55.43 12.03 18.03 21.41 8.00 5.58 $12,245 5,957 2,419 1,732 728 375 $11,906 5,848 2,346 1,245 355 982 3.5x 4.2 3.7 1.5 2.4 1.9 2.5x 3.3 2.1 1.3 1.3 1.7 39.1% 28.1% 72.2% 14.4% 76.6% 12.7% Source: Factset (as of 6/26/20), Company filings, Wall Street Research 34 Mean $3,909 $3,780 2.9x 2.0x 40.8% Median 2,076 1,796 2.9x 1.9x 28.1% |
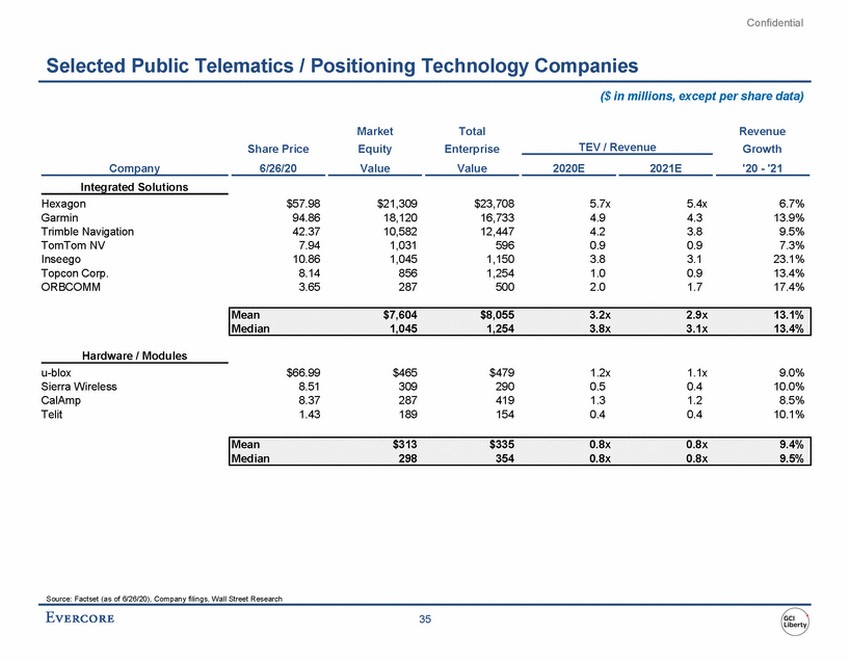 |
Confidential Selected Public Telematics / Positioning Technology Companies ($ in millions, except per share data) Market Equity Total Enterprise Revenue Growth TEV / Revenue Share Price Company 6/26/20 Value Value 2020E 2021E '20 - '21 Integrated Solutions Hexagon Garmin Trimble Navigation TomTom NV Inseego Topcon Corp. ORBCOMM $57.98 94.86 42.37 7.94 10.86 8.14 3.65 $21,309 18,120 10,582 1,031 1,045 856 287 $23,708 16,733 12,447 596 1,150 1,254 500 5.7x 4.9 4.2 0.9 3.8 1.0 2.0 5.4x 4.3 3.8 0.9 3.1 0.9 1.7 6.7% 13.9% 9.5% 7.3% 23.1% 13.4% 17.4% Hardware / Modules u-blox Sierra Wireless CalAmp Telit $66.99 8.51 8.37 1.43 $465 309 287 189 $479 290 419 154 1.2x 0.5 1.3 0.4 1.1x 0.4 1.2 0.4 9.0% 10.0% 8.5% 10.1% Source: Factset (as of 6/26/20), Company filings, Wall Street Research 35 Mean $313 $335 0.8x 0.8x 9.4% Median 298 354 0.8x 0.8x 9.5% Mean $7,604 $8,055 3.2x 2.9x 13.1% Median 1,045 1,254 3.8x 3.1x 13.4% |
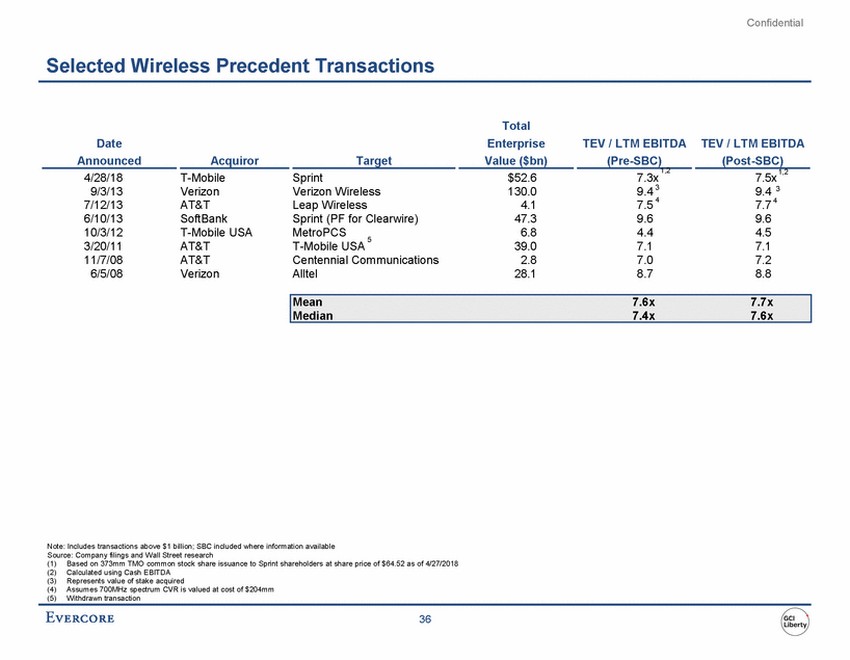 |
Confidential Selected Wireless Precedent Transactions Total Enterprise Value ($bn) Date Announced TEV / LTM EBITDA (Pre-SBC) 1,2 TEV / LTM EBITDA (Post-SBC) Acquiror Target 1,2 4/28/18 9/3/13 7/12/13 6/10/13 10/3/12 3/20/11 11/7/08 6/5/08 T-Mobile Verizon AT&T SoftBank T-Mobile USA AT&T AT&T Verizon Sprint Verizon Wireless Leap Wireless Sprint (PF for Clearwire) $52.6 130.0 4.1 47.3 6.8 39.0 2.8 28.1 7.3x 7.5x 9.4 3 7.5 4 9.6 4.4 7.1 7.0 8.7 9.4 3 7.7 4 9.6 4.5 7.1 7.2 8.8 MetroPCS T-Mobile USA 5 Centennial Communications Alltel Note: Includes transactions above $1 billion; SBC included where information available Source: Company filings and Wall Street research (1) (2) (3) (4) (5) Based on 373mm TMO common stock share issuance to Sprint shareholders at share price of $64.52 as of 4/27/2018 Calculated using Cash EBITDA Represents value of stake acquired Assumes 700MHz spectrum CVR is valued at cost of $204mm Withdrawn transaction 36 Mean 7.6x 7.7x Median 7.4x 7.6x |
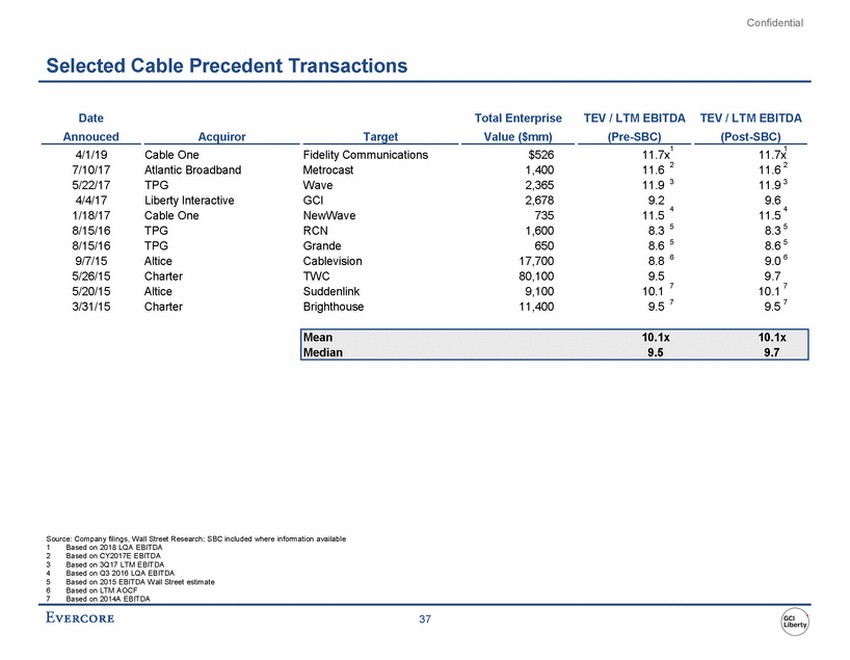 |
Confidential Selected Cable Precedent Transactions Date Annouced Total Enterprise Value ($mm) TEV / LTM EBITDA (Pre-SBC) TEV / LTM EBITDA (Post-SBC) Acquiror Target 1 1 4/1/19 7/10/17 5/22/17 4/4/17 1/18/17 8/15/16 8/15/16 9/7/15 5/26/15 5/20/15 3/31/15 Cable One Atlantic Broadband TPG Liberty Interactive Cable One TPG TPG Altice Charter Altice Charter Fidelity Communications Metrocast Wave GCI NewWave RCN Grande Cablevision TWC Suddenlink Brighthouse $526 1,400 2,365 2,678 735 1,600 650 17,700 80,100 9,100 11,400 11.7x 11.7x 11.6 2 11.9 3 9.6 11.6 2 11.9 3 9.2 4 4 11.5 8.3 8.6 8.8 9.5 10.1 9.5 11.5 5 5 6 8.3 5 8.6 5 9.0 6 9.7 10.1 7 9.5 7 7 7 Source: Company filings, Wall Street Research; SBC included where information available 1 2 3 4 5 6 7 Based on 2018 LQA EBITDA Based on CY2017E EBITDA Based on 3Q17 LTM EBITDA Based on Q3 2016 LQA EBITDA Based on 2015 EBITDA Wall Street estimate Based on LTM AOCF Based on 2014A EBITDA 37 Mean 10.1x 10.1x Median 9.5 9.7 |
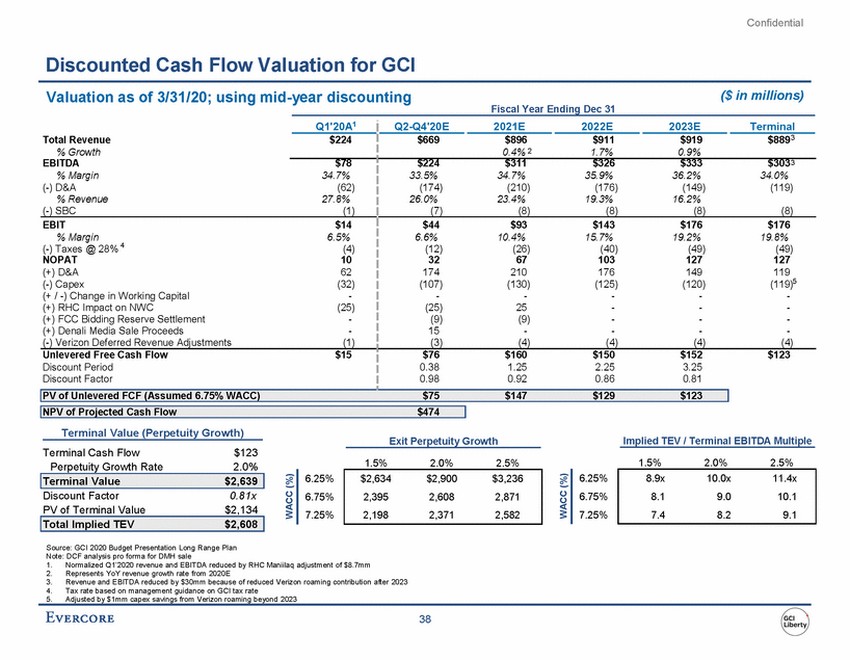 |
Confidential Discounted Cash Flow Valuation for GCI Valuation as of 3/31/20; using mid-year discounting ($ in millions) Fiscal Year Ending Dec 31 (12) (26) (40) (49) (49) Terminal Value (Perpetuity Growth) Exit Perpetuity Growth Implied TEV / Terminal EBITDA Multiple Terminal Cash Flow Perpetuity Growth Rate $123 2.0% 1.5% 2.0% 2.5% 1.5% 2.0% 2.5% 6.25% 6.75% 7.25% 6.25% 6.75% 7.25% Discount Factor PV of Terminal Value 0.81x $2,134 Source: GCI 2020 Budget Presentation Long Range Plan Note: DCF analysis pro forma for DMH sale 1. 2. 3. 4. 5. Normalized Q1’2020 revenue and EBITDA reduced by RHC Maniilaq adjustment of $8.7mm Represents YoY revenue growth rate from 2020E Revenue and EBITDA reduced by $30mm because of reduced Verizon roaming contribution after 2023 Tax rate based on management guidance on GCI tax rate Adjusted by $1mm capex savings from Verizon roaming beyond 2023 38 WACC (%) WACC (%) Total Implied TEV $2,608 Terminal Value $2,639 8.9x 10.0x 11.4x 8.1 9.0 10.1 7.4 8.2 9.1 $2,634 $2,900 $3,236 2,395 2,608 2,871 2,198 2,371 2,582 Total Revenue % Growth EBITDA % Margin (-) D&A % Revenue (-) SBC Q1'20A1 Q2-Q4'20E 2021E 2022E 2023E Terminal $224 $669 $896 $911 $919 $8893 0.4% 21.7% 0.9% $78 34.7% (62) 27.8% (1) $224 $311 $326 $333 $3033 33.5% 34.7% 35.9% 36.2% 34.0% (174) (210) (176) (149) (119) 26.0% 23.4% 19.3% 16.2% (7) (8) (8) (8) (8) EBIT $14 % Margin 6.5% (-) Taxes @ 28% 4(4) NOPAT 10 (+) D&A 62 (-) Capex (32) (+ / -) Change in Working Capital - (+) RHC Impact on NWC (25) (+) FCC Bidding Reserve Settlement - (+) Denali Media Sale Proceeds - (-) Verizon Deferred Revenue Adjustments (1) $44 $93 $143 $176 $176 6.6% 10.4% 15.7% 19.2% 19.8% 32 67 103 127 127 174 210 176 149 119 (107) (130) (125) (120) (119)5 - - - - - (25) 25 - - - (9) (9) - - - 15 - - - - (3) (4) (4) (4) (4) Unlevered Free Cash Flow $15 Discount Period Discount Factor $76 $160 $150 $152 $123 0.38 1.25 2.25 3.25 0.98 0.92 0.86 0.81 PV of Unlevered FCF (Assumed 6.75% WACC) $75 $147 $129 $123 NPV of Projected Cash Flow $474 |
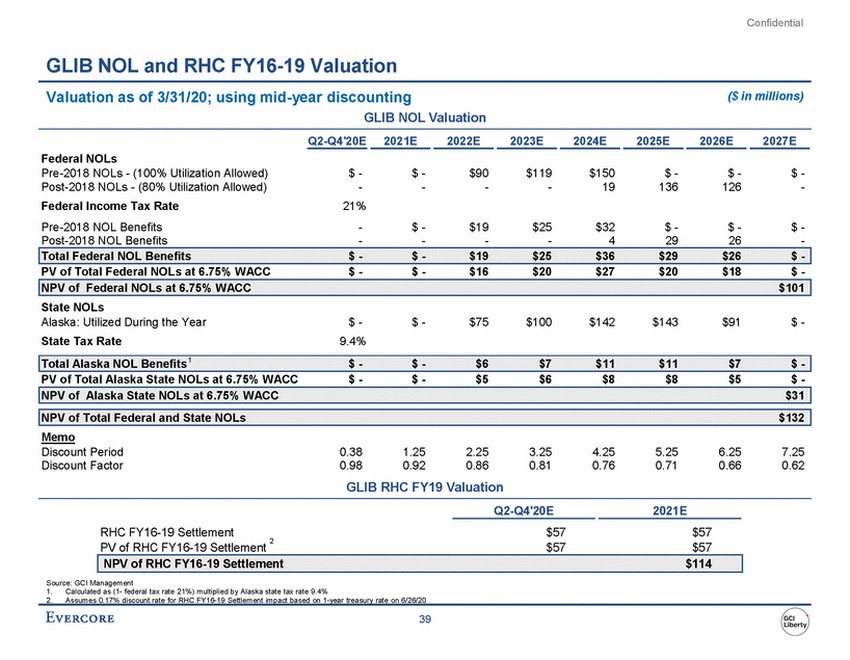 |
Confidential GLIB NOL and RHC FY16-19 Valuation Valuation as of 3/31/20; using mid-year discounting GLIB NOL Valuation ($ in millions) Q2-Q4'20E 2021E 2022E 2023E 2024E 2025E 2026E 2027E Federal NOLs Pre-2018 NOLs - (100% Utilization Allowed) Post-2018 NOLs - (80% Utilization Allowed) Federal Income Tax Rate Pre-2018 NOL Benefits Post-2018 NOL Benefits $ - - 21% - - $ - - $90 - $119 - $150 19 $ - 136 $ - 126 $ - - $ - - $19 - $25 - $32 4 $ - 29 $ - 26 $ - - PV of Total Federal NOLs at 6.75% WACC $ - $ - $16 $20 $27 $20 $18 $ - State NOLs Alaska: Utilized During the Year State Tax Rate $ - 9.4% $ - $75 $100 $142 $143 $91 $ - PV of Total Alaska State NOLs at 6.75% WACC $ - $ - $5 $6 $8 $8 $5 $ - Memo Discount Period Discount Factor 0.38 0.98 1.25 0.92 2.25 0.86 3.25 0.81 4.25 0.76 5.25 0.71 6.25 0.66 7.25 0.62 GLIB RHC FY19 Valuation Q2-Q4'20E 2021E RHC FY16-19 Settlement PV of RHC FY16-19 Settlement $57 $57 $57 $57 2 Source: GCI Management 1. Calculated as (1-federal tax rate 21%) multiplied by Alaska state tax rate 9.4% 2. Assumes 0.17% discount rate for RHC FY16-19 Settlement impact based on 1-year treasury rate on 6/26/20 39 NPV of RHC FY16-19 Settlement$114 NPV of Total Federal and State NOLs $132 NPV of Alaska State NOLs at 6.75% WACC $31 Total Alaska NOL Benefits1 $ - $ - $6 $7 $11 $11 $7 $ - NPV of Federal NOLs at 6.75% WACC $101 Total Federal NOL Benefits $ - $ - $19 $25 $36 $29 $26 $ - |
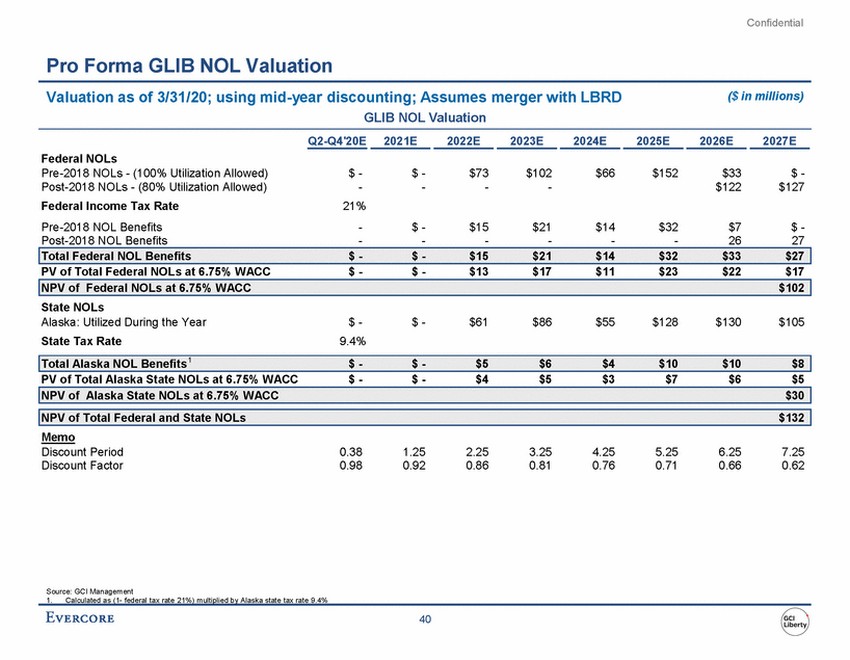 |
Confidential Pro Forma GLIB NOL Valuation Valuation as of 3/31/20; using mid-year discounting; Assumes merger with LBRD GLIB NOL Valuation ($ in millions) Q2-Q4'20E 2021E 2022E 2023E 2024E 2025E 2026E 2027E Federal NOLs Pre-2018 NOLs - (100% Utilization Allowed) Post-2018 NOLs - (80% Utilization Allowed) Federal Income Tax Rate Pre-2018 NOL Benefits Post-2018 NOL Benefits $ - - 21% - - $ - - $73 - $102 - $66 $152 $33 $122 $ - $127 $ - - $15 - $21 - $14 - $32 - $7 26 $ - 27 PV of Total Federal NOLs at 6.75% WACC $ - $ - $13 $17 $11 $23 $22 $17 State NOLs Alaska: Utilized During the Year State Tax Rate $ - 9.4% $ - $61 $86 $55 $128 $130 $105 PV of Total Alaska State NOLs at 6.75% WACC $ - $ - $4 $5 $3 $7 $6 $5 Memo Discount Period Discount Factor 0.38 0.98 1.25 0.92 2.25 0.86 3.25 0.81 4.25 0.76 5.25 0.71 6.25 0.66 7.25 0.62 Source: GCI Management 1. Calculated as (1-federal tax rate 21%) multiplied by Alaska state tax rate 9.4% 40 NPV of Total Federal and State NOLs $132 NPV of Alaska State NOLs at 6.75% WACC $30 Total Alaska NOL Benefits1 $ - $ - $5 $6 $4 $10 $10 $8 NPV of Federal NOLs at 6.75% WACC $102 Total Federal NOL Benefits $ - $ - $15 $21 $14 $32 $33 $27 |
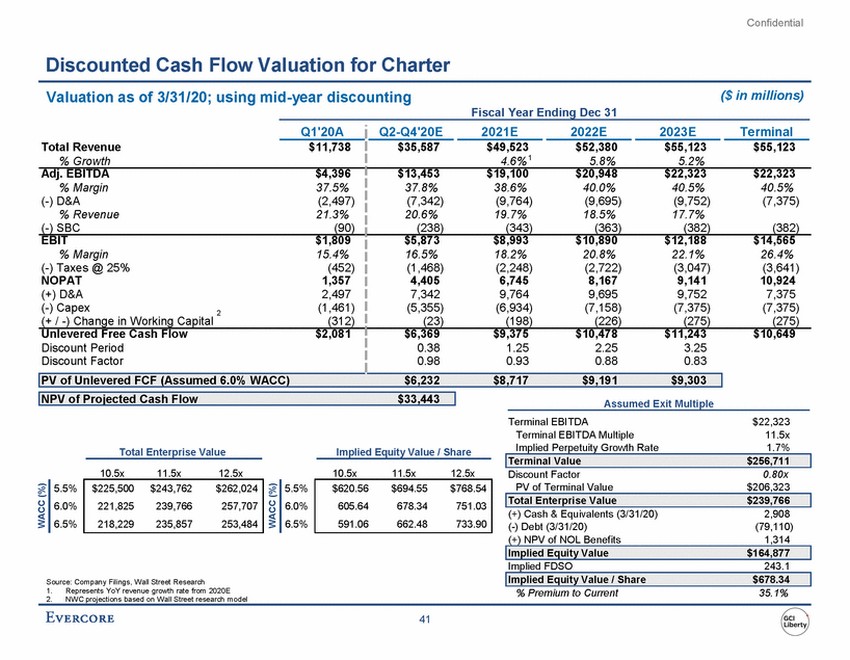 |
Confidential Discounted Cash Flow Valuation for Charter Valuation as of 3/31/20; using mid-year discounting ($ in millions) Fiscal Year Ending Dec 31 (23) (198) (226) (275) (275) Terminal EBITDA Terminal EBITDA Multiple Implied Perpetuity Growth Rate $22,323 11.5x 1.7% Total Enterprise Value Implied Equity Value / Share 10.5x 11.5x 12.5x 10.5x 11.5x 12.5x Discount Factor PV of Terminal Value 0.80x $206,323 5.5% 6.0% 6.5% 5.5% 6.0% 6.5% (+) Cash & Equivalents (3/31/20) (-) Debt (3/31/20) (+) NPV of NOL Benefits 2,908 (79,110) 1,314 Implied FDSO 243.1 Source: Company Filings, Wall Street Research 1. 2. Represents YoY revenue growth rate from 2020E NWC projections based on Wall Street research model % Premium to Current 35.1% 41 WACC (%) WACC (%) Implied Equity Value / Share $678.34 Implied Equity Value $164,877 Total Enterprise Value $239,766 $620.56 $694.55 $768.54 605.64 678.34 751.03 591.06 662.48 733.90 $225,500 $243,762 $262,024 221,825 239,766 257,707 218,229 235,857 253,484 Terminal Value $256,711 Total Revenue % Growth Q1'20A Q2-Q4'20E 2021E 2022E 2023E Terminal $11,738 $35,587$49,523$52,380$55,123$55,123 4.6% 15.8%5.2% Adj. EBITDA$4,396 % Margin37.5% (-) D&A(2,497) % Revenue21.3% (-) SBC(90) $13,453$19,100$20,948$22,323$22,323 37.8%38.6%40.0%40.5%40.5% (7,342)(9,764)(9,695)(9,752)(7,375) 20.6%19.7%18.5%17.7% (238)(343)(363)(382)(382) EBIT$1,809 % Margin15.4% (-) Taxes @ 25%(452) NOPAT1,357 (+) D&A2,497 (-) Capex2(1,461) (+ / -) Change in Working Capital(312) $5,873$8,993$10,890$12,188$14,565 16.5%18.2%20.8%22.1%26.4% (1,468)(2,248)(2,722)(3,047)(3,641) 4,4056,7458,1679,14110,924 7,3429,7649,6959,7527,375 (5,355)(6,934)(7,158)(7,375)(7,375) Unlevered Free Cash Flow$2,081 Discount Period Discount Factor $6,369$9,375$10,478$11,243$10,649 0.381.252.253.25 0.980.930.880.83 PV of Unlevered FCF (Assumed 6.0% WACC)$6,232$8,717$9,191$9,303 NPV of Projected Cash Flow$33,443 Assumed Exit Multiple |
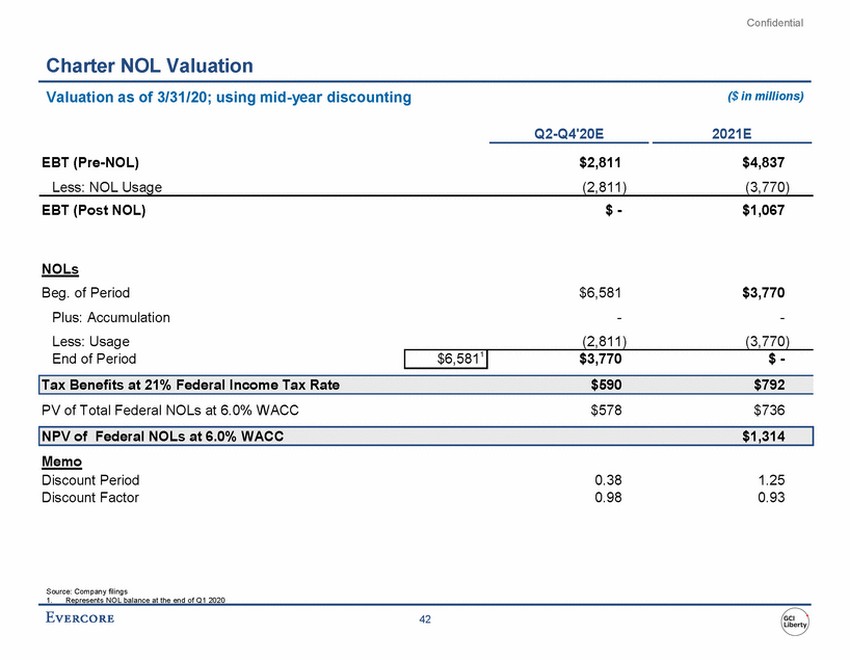 |
Confidential Charter NOL Valuation Valuation as of 3/31/20; using mid-year discounting ($ in millions) Q2-Q4'20E 2021E EBT (Pre-NOL) Less: NOL Usage $2,811 (2,811) $4,837 (3,770) EBT (Post NOL) $ - $1,067 NOLs Beg. of Period Plus: Accumulation Less: Usage End of Period $6,581 - (2,811) $3,770 - (3,770) PV of Total Federal NOLs at 6.0% WACC $578 $736 Memo Discount Period Discount Factor 0.38 0.98 1.25 0.93 Source: Company filings 1. Represents NOL balance at the end of Q1 2020 42 NPV of Federal NOLs at 6.0% WACC$1,314 Tax Benefits at 21% Federal Income Tax Rate$590$792 $6,5811 $3,770$ - |
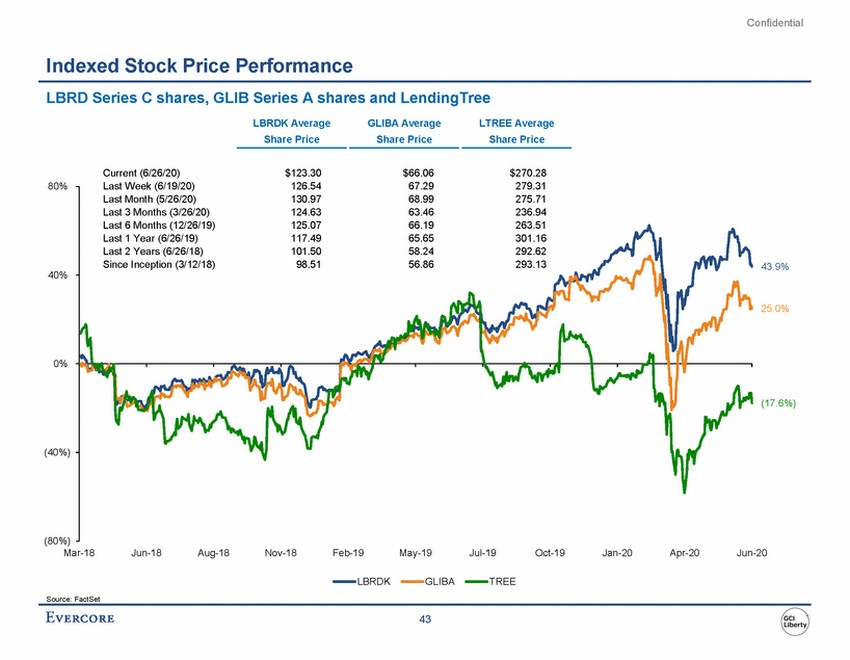 |
Confidential Indexed Stock Price Performance LBRD Series C shares, GLIB Series A shares and LendingTree LBRDK Average Share Price GLIBA Average Share Price LTREE Average Share Price Current (6/26/20) Last Week (6/19/20) $123.30 126.54 $66.06 67.29 $270.28 279.31 80% 43.9% 40% 25.0% 0% (17.6%) (40%) (80%) Mar-18 Jun-18 Aug-18 Nov-18 Feb-19 May-19 Jul-19 Oct-19 Jan-20 Apr-20 Jun-20 LBRDK GLIBA TREE Source: FactSet 43 Last Month (5/26/20)130.9768.99275.71 Last 3 Months (3/26/20)124.6363.46236.94 Last 6 Months (12/26/19)125.0766.19263.51 Last 1 Year (6/26/19)117.4965.65301.16 Last 2 Years (6/26/18)101.5058.24292.62 Since Inception (3/12/18)98.5156.86293.13 |
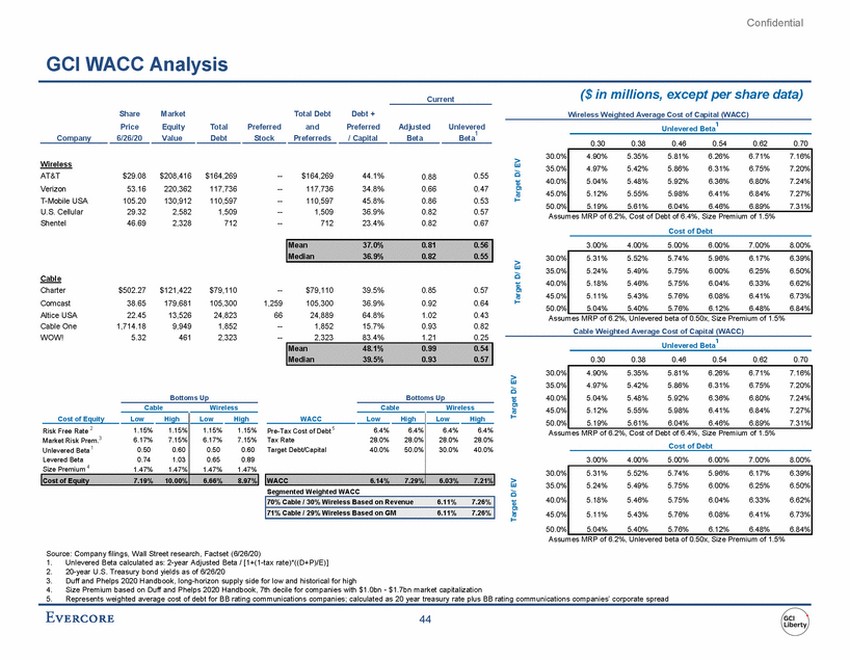 |
Confidential GCI WACC Analysis ($ in millions, except per share data) Wireless Weighted Average Cost of Capital (WACC) Current Share Price 6/26/20 Market Equity Value Total Debt and Preferreds Debt + Preferred / Capital 1 Total Debt Preferred Stock Adjusted Beta Unlevered Unlevered Beta 1 Company Beta 0.30 0.38 0.46 0.54 0.62 0.70 30.0% 35.0% 40.0% 45.0% 50.0% Wireless AT&T Verizon T-Mobile USA U.S. Cellular Shentel $29.08 53.16 105.20 29.32 46.69 $208,416 220,362 130,912 2,582 2,328 $164,269 117,736 110,597 1,509 712 ---- ---- --$164,269 117,736 110,597 1,509 712 44.1% 34.8% 45.8% 36.9% 23.4% 0.55 0.47 0.53 0.57 0.67 0.88 0.66 0.86 0.82 0.82 Assumes MRP of 6.2%, Cost of Debt of 6.4%, Size Premium of 1.5% Cost of Debt 3.00% 4.00% 5.00% 6.00% 7.00% 8.00% 30.0% 35.0% 40.0% 45.0% 50.0% Cable Charter Comcast Altice USA Cable One WOW! $502.27 38.65 22.45 1,714.18 5.32 $121,422 179,681 13,526 9,949 461 $79,110 105,300 24,823 1,852 2,323 --1,259 66 ---- $79,110 105,300 24,889 1,852 2,323 39.5% 36.9% 64.8% 15.7% 83.4% 0.85 0.92 1.02 0.93 1.21 0.57 0.64 0.43 0.82 0.25 Assumes MRP of 6.2%, Unlevered beta of 0.50x, Size Premium of 1.5% Cable Weighted Average Cost of Capital (WACC) 1 Unlevered Beta 0.30 0.38 0.46 0.54 0.62 0.70 30.0% 35.0% 40.0% 45.0% 50.0% Bottoms Up Bottoms Up Cable Wireless Cable Wireless Risk Free Rate Pre-Tax Cost of Debt Assumes MRP of 6.2%, Cost of Debt of 6.4%, Size Premium of 1.5% Cost of Debt 3.00% 4.00% 5.00% 6.00% 7.00% 8.00% 30.0% 35.0% 40.0% 45.0% 50.0% Segmented Weighted WACC Assumes MRP of 6.2%, Unlevered beta of 0.50x, Size Premium of 1.5% Source: Company filings, Wall Street research, Factset (6/26/20) 1. 2. 3. 4. 5. Unlevered Beta calculated as: 2-year Adjusted Beta / [1+(1-tax rate)*((D+P)/E)] 20-year U.S. Treasury bond yields as of 6/26/20 Duff and Phelps 2020 Handbook, long-horizon supply side for low and historical for high Size Premium based on Duff and Phelps 2020 Handbook, 7th decile for companies with $1.0bn - $1.7bn market capitalization Represents weighted average cost of debt for BB rating communications companies; calculated as 20 year treasury rate plus BB rating communications companies’ corporate spread 44 Target D/ EV Target D/ EV Target D/ EV Target D/ EV 70% Cable / 30% Wireless Based on Revenue 6.11% 7.26% 71% Cable / 29% Wireless Based on GM 6.11% 7.26% 5.31% 5.52% 5.74% 5.96% 6.17% 6.39% 5.24% 5.49% 5.75% 6.00% 6.25% 6.50% 5.18% 5.46% 5.75% 6.04% 6.33% 6.62% 5.11% 5.43% 5.76% 6.08% 6.41% 6.73% 5.04% 5.40% 5.76% 6.12% 6.48% 6.84% WACC Low High Low High 5 6.4% 6.4% Tax Rate 28.0% 28.0% Target Debt/Capital 40.0% 50.0% 6.4% 6.4% 28.0% 28.0% 30.0% 40.0% WACC 6.14% 7.29% 6.03% 7.21% Cost of Equity Low High Low High 2 1.15% 1.15% Market Risk Prem.3 6.17% 7.15% Unlevered Beta 1 0.50 0.60 Levered Beta 0.74 1.03 4 Size Premium 1.47% 1.47% 1.15% 1.15% 6.17% 7.15% 0.50 0.60 0.65 0.89 1.47% 1.47% Cost of Equity 7.19% 10.00% 6.66% 8.97% 4.90% 5.35% 5.81% 6.26% 6.71% 7.16% 4.97% 5.42% 5.86% 6.31% 6.75% 7.20% 5.04% 5.48% 5.92% 6.36% 6.80% 7.24% 5.12% 5.55% 5.98% 6.41% 6.84% 7.27% 5.19% 5.61% 6.04% 6.46% 6.89% 7.31% Mean 48.1% 0.99 0.54 Median 39.5% 0.93 0.57 5.31% 5.52% 5.74% 5.96% 6.17% 6.39% 5.24% 5.49% 5.75% 6.00% 6.25% 6.50% 5.18% 5.46% 5.75% 6.04% 6.33% 6.62% 5.11% 5.43% 5.76% 6.08% 6.41% 6.73% 5.04% 5.40% 5.76% 6.12% 6.48% 6.84% Mean 37.0% 0.81 0.56 Median 36.9% 0.82 0.55 4.90% 5.35% 5.81% 6.26% 6.71% 7.16% 4.97% 5.42% 5.86% 6.31% 6.75% 7.20% 5.04% 5.48% 5.92% 6.36% 6.80% 7.24% 5.12% 5.55% 5.98% 6.41% 6.84% 7.27% 5.19% 5.61% 6.04% 6.46% 6.89% 7.31% |
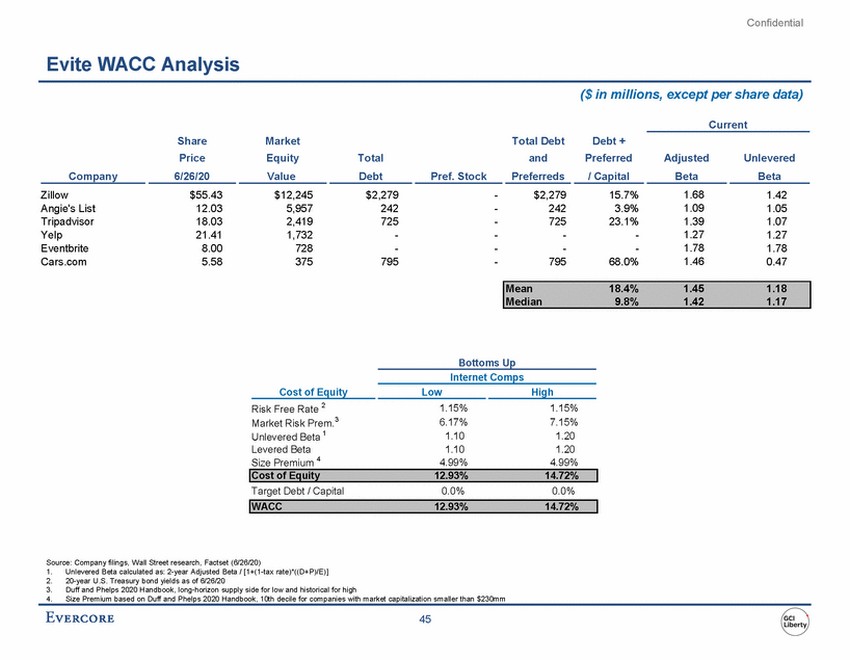 |
Confidential Evite WACC Analysis ($ in millions, except per share data) Current Share Price Market Equity Total Debt and Debt + Preferred Total Adjusted Unlevered Company 6/26/20 Value Debt Pref. Stock Preferreds / Capital Beta Beta Zillow Angie's List Tripadvisor Yelp Eventbrite Cars.com $55.43 12.03 18.03 21.41 8.00 5.58 $12,245 5,957 2,419 1,732 728 375 $2,279 242 725 - - 795 - - - - - - $2,279 242 725 - - 795 15.7% 3.9% 23.1% - - 68.0% 1.68 1.09 1.39 1.27 1.78 1.46 1.42 1.05 1.07 1.27 1.78 0.47 Bottoms Up Internet Comps Cost of Equity Low High Risk Free Rate 2 Market Risk Prem.3 Unlevered Beta 1 Levered Beta Size Premium 4 1.15% 6.17% 1.10 1.10 4.99% 1.15% 7.15% 1.20 1.20 4.99% Target Debt / Capital 0.0% 0.0% Source: Company filings, Wall Street research, Factset (6/26/20) 1. 2. 3. 4. Unlevered Beta calculated as: 2-year Adjusted Beta / [1+(1-tax rate)*((D+P)/E)] 20-year U.S. Treasury bond yields as of 6/26/20 Duff and Phelps 2020 Handbook, long-horizon supply side for low and historical for high Size Premium based on Duff and Phelps 2020 Handbook, 10th decile for companies with market capitalization smaller than $230mm 45 WACC 12.93% 14.72% Cost of Equity 12.93% 14.72% Mean18.4%1.451.18 Median9.8%1.421.17 |
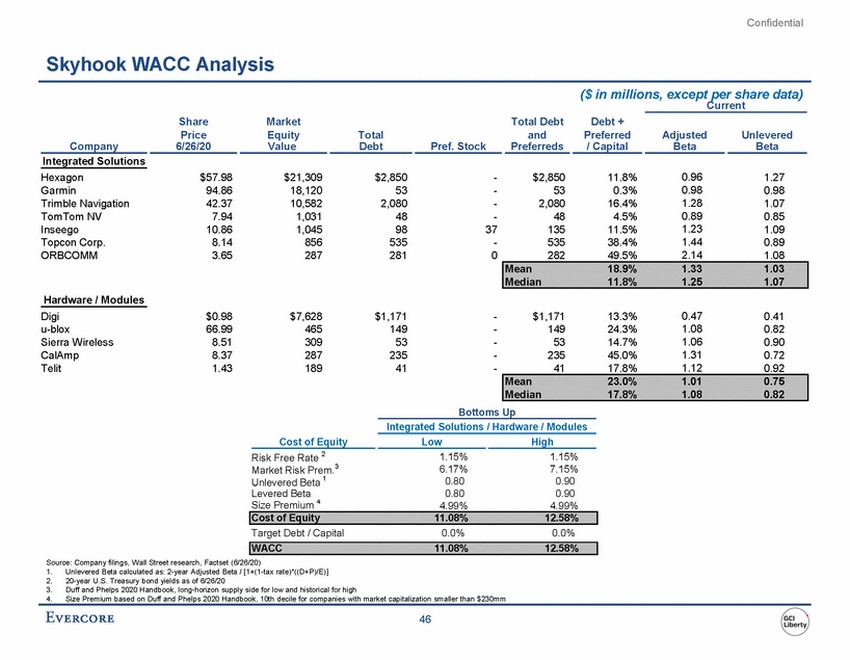 |
Confidential Skyhook WACC Analysis ($ in millions, except per share data) Current Share Price Market Equity Total Debt and Debt + Preferred Total Adjusted Unlevered Company 6/26/20 Value Debt Pref. Stock Preferreds / Capital Beta Beta Integrated Solutions Hexagon Garmin Trimble Navigation TomTom NV Inseego Topcon Corp. ORBCOMM $57.98 94.86 42.37 7.94 10.86 8.14 3.65 $21,309 18,120 10,582 1,031 1,045 856 287 $2,850 53 2,080 48 98 535 281 - - - - 37 - 0 $2,850 53 2,080 48 135 535 282 11.8% 0.3% 16.4% 4.5% 11.5% 38.4% 49.5% 0.96 0.98 1.28 0.89 1.23 1.44 2.14 1.27 0.98 1.07 0.85 1.09 0.89 1.08 Hardware / Modules 0.47 1.08 1.06 1.31 1.12 Digi u-blox Sierra Wireless CalAmp Telit $0.98 66.99 8.51 8.37 1.43 $7,628 465 309 287 189 $1,171 149 53 235 41 - - - - - $1,171 149 53 235 41 13.3% 24.3% 14.7% 45.0% 17.8% 0.41 0.82 0.90 0.72 0.92 Bottoms Up Integrated Solutions / Hardware / Modules Cost of Equity Low High Risk Free Rate 2 Market Risk Prem.3 Unlevered Beta 1 Levered Beta Size Premium 4 1.15% 6.17% 0.80 0.80 4.99% 1.15% 7.15% 0.90 0.90 4.99% Target Debt / Capital 0.0% 0.0% Source: Company filings, Wall Street research, Factset (6/26/20) 1. 2. 3. 4. Unlevered Beta calculated as: 2-year Adjusted Beta / [1+(1-tax rate)*((D+P)/E)] 20-year U.S. Treasury bond yields as of 6/26/20 Duff and Phelps 2020 Handbook, long-horizon supply side for low and historical for high Size Premium based on Duff and Phelps 2020 Handbook, 10th decile for companies with market capitalization smaller than $230mm 46 WACC 11.08% 12.58% Cost of Equity 11.08% 12.58% Mean 23.0% 1.01 0.75 Median 17.8% 1.08 0.82 Mean 18.9% 1.33 1.03 Median 11.8% 1.25 1.07 |
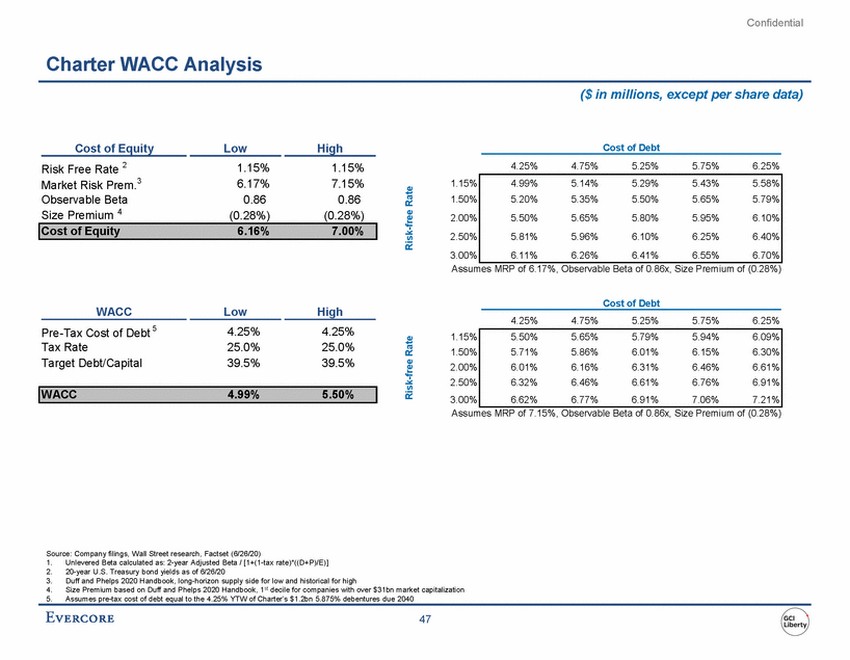 |
Confidential Charter WACC Analysis ($ in millions, except per share data) Cost of Equity Low High Cost of Debt Risk Free Rate 2 Market Risk Prem.3 Observable Beta Size Premium 4 4.25% 4.75% 5.25% 5.75% 6.25% 1.15% 6.17% 0.86 (0.28%) 1.15% 7.15% 0.86 (0.28%) 1.15% 1.50% 2.00% 2.50% 3.00% Assumes MRP of 6.17%, Observable Beta of 0.86x, Size Premium of (0.28%) Cost of Debt WACC Low High 4.25% 4.75% 5.25% 5.75% 6.25% Pre-Tax Cost of Debt 5 Tax Rate Target Debt/Capital 4.25% 25.0% 39.5% 4.25% 25.0% 39.5% 1.15% 1.50% 2.00% 2.50% 3.00% Assumes MRP of 7.15%, Observable Beta of 0.86x, Size Premium of (0.28%) Source: Company filings, Wall Street research, Factset (6/26/20) 1. 2. 3. 4. 5. Unlevered Beta calculated as: 2-year Adjusted Beta / [1+(1-tax rate)*((D+P)/E)] 20-year U.S. Treasury bond yields as of 6/26/20 Duff and Phelps 2020 Handbook, long-horizon supply side for low and historical for high Size Premium based on Duff and Phelps 2020 Handbook, 1st decile for companies with over $31bn market capitalization Assumes pre-tax cost of debt equal to the 4.25% YTW of Charter’s $1.2bn 5.875% debentures due 2040 47 Risk-free Rate Risk-free Rate WACC 4.99% 5.50% 5.50%5.65%5.79%5.94%6.09% 5.71%5.86%6.01%6.15%6.30% 6.01%6.16%6.31%6.46%6.61% 6.32%6.46%6.61%6.76%6.91% 6.62%6.77%6.91%7.06%7.21% Cost of Equity 6.16% 7.00% 4.99%5.14%5.29%5.43%5.58% 5.20%5.35%5.50%5.65%5.79% 5.50%5.65%5.80%5.95%6.10% 5.81%5.96%6.10%6.25%6.40% 6.11%6.26%6.41%6.55%6.70% |